
April 10, 2026


Despite widespread concerns about inflation and the economy, actual consumer behavior shows continued willingness to spend on discretionary and “wellness” categories, highlighting a gap be-tween stated intentions to cut back and real pur-chasing decisions.
Consumption has been supported by tax refunds and easy access to credit, including credit cards and “buy now, pay later” options, but rising late payments, higher energy prices, and a cooling la-bor market point to growing pressures on house-hold finances.
Long‑term trends favor sectors tied to experienc-es, convenience, and health, with commercial real estate adapting toward experience‑driven for-mats, healthcare shifting toward cost‑sensitive wellness solutions like GLP‑1 drugs, and younger consumers ‑ especially Gen Z ‑ emerging as a structurally higher‑spending force.
It has been long said that the American economy re-lies more on the health of its consumers than on other factors. However, since the start of the Covid‑19 pan-demic, the U.S. consumer has seen a shift in its spend-ing trends: its pent‑up savings have been allocated towards services instead of goods, with a stark inten-tion to make up for the time of lockdown. However, as those trends have begun to shift once again, we want-ed to examine more closely what has been driving U.S. consumption, what current consumer trends suggest, and what new shifts are emerging from them.
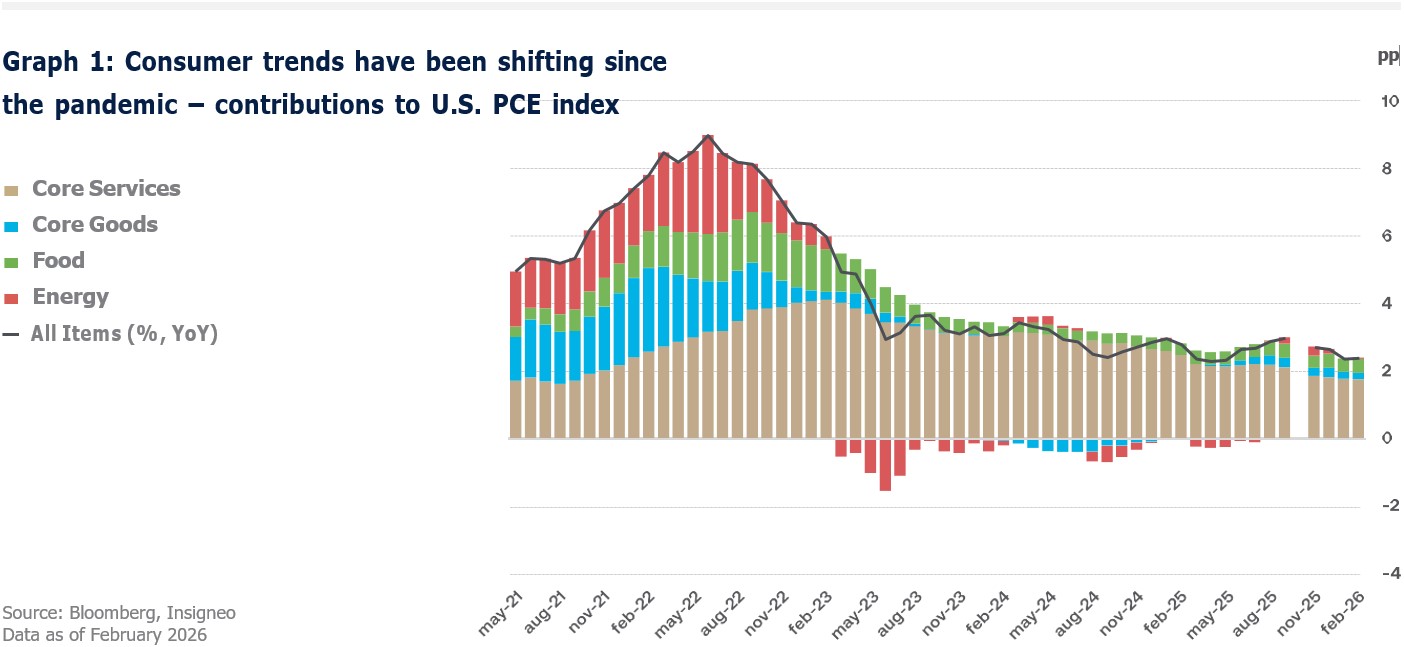
When looking at the consumer trends of the last five years – namely the period right out of the pandemic – a stark contrast emerges between household con-sumption of goods and services. Within the personal consumption expenditure component of GDP, ser-vices have surpassed goods in terms of contribution to GDP in 16 of the last 18 quarters. When looking at both categories from the perspective of the Personal Consumption Expenditure – PCE – index, the con-sumption of non‑durable goods has been decreasing since its peak around 2022, now being fully replaced by services in terms of contributions to the PCE. As can be seen in graph 1, core services accounted for 1.773pp of February’s PCE print, in contrast to the 0.193 of core goods.
Furthermore, the strong momentum in personal con-sumption expenditures could gain further support from higher refunds stemming from the approval of the One Big Beautiful Bill. This tax season, refunds are expected to boost real disposable personal in-come during 1Q26. However, it is worth noting that a relevant part of the spending performed by the U.S. consumer was propelled by the excess savings it
gathered during the pandemic, and those savings are starting to look depleted. According to data from BCA Research, the U.S. personal savings rate as a percent of disposable income is currently far below its 2019 average (4.5% vs 7.3%).
Another factor that has underpinned strong con-sumption in the years since the pandemic has been
U.S. consumer’s ability to access credit, whether through credit cards or through newer “buy now, pay later” (BNPL) financing mechanisms. According to a recent study run by the Richmond Fed, the BNPL purchase volume in 2025 was roughly USD 70bn, which is still small when compared to the USD 6.3tn recorded in credit card purchase volume that same year. However, there are some initial signs that late payment and delinquency behavior among BNPL us-ers have increased since 2023. To that point, a Lend-ingTree survey from 2025 reported that 41% of BNPL users made at least one late payment in the past year, up from 34% a year earlier. Even if the survey stated that there is no direct evidence of rising ag-gregate BNPL charge‑off rates to date, continued monitoring is warranted.
Furthermore, it is important to note that any addition-al cushion to consumer savings from the previously discussed tax relief measures could be partially off-set by higher gasoline prices stemming from the Iran conflict. The U.S. consumer is entering this oil shock price with depleted savings and a more reduced ca-pacity to endure the current market disruption, which in turn may lead to a shift in consumption preferenc-es to allocate a higher share of the budget to account for non-discretionary energy expenses. According to Wells Fargo, the situation would be more challenging for the U.S. consumer if energy prices remain elevated for a long time, since energy inflation could offset meaningful portions of real income growth – even more so when the labor market is starting to cool, and excess savings have been consumed almost entirely.
Lastly, all factors mentioned above are expected to dent consumer confidence in the future, even if the latest figures have not penciled in a deterioration yet. March’s print of the Conference Board consumer confidence stood at 91.8, higher than the 87.9 ex-pected by the market; still, some other measures within the report – such as inflation expectations – are starting to reflect the effects of rising costs from tariffs. To that extent, consumers’ average 12‑month inflation expectations increased from 5.5% to 6.2%, while the median rose from 4.5% to 5.2%.
With that in mind, let us explore the consumer trends that we have identified.
Have you seen headlines about a U.S. recession, a weakening job market, and ongoing wars, and then walked into a packed restaurant and wondered how it makes sense? The answer lies in how consumer behavior reset after the pandemic. COVID accelerat-ed nearly a decade of digital adoption in less than a year and reinforced a “life is now” mindset that did not exist before. As a result, consumers are increas-ingly willing to pay for experiences rather than just goods, reshaping the winners and losers in all kinds of industries, going from real estate to healthcare and technology. While consumers claim they intend to save more and cut spending in certain categories, actual behavior shows the opposite. Spending on ex-periences and services continues to rise, with the “splurge” category taking a larger share of income. As shown in Graph 2, there is a clear disconnect be-tween what consumers say and how they actually behave. Despite being the category where consum-ers expect to cut back the most, splurging, which in-cludes jewelry, flights, furniture, and other nonessen-tial goods, has actually seen the strongest consumption growth. We can call this category “wellness”, and that’s where consumers are paying the most.
At the same time, daily life has evolved meaningfully, with individuals spending more time alone and on-line, the three additional hours of free time gained compared to 2019 are increasingly allocated to solo activities such as shopping, fitness, and social media. Remote work and the expansion of e‑commerce have reshaped how time is used, reinforcing a “bring it to me” mindset and raising expectations around speed, convenience, and on‑demand services.
While these affect every generation, their impact is likely to be larger among Gen Z, which, according to
Graph 2: Consumption Growth vs Future Net Purchase Intent, % (n=4,000)
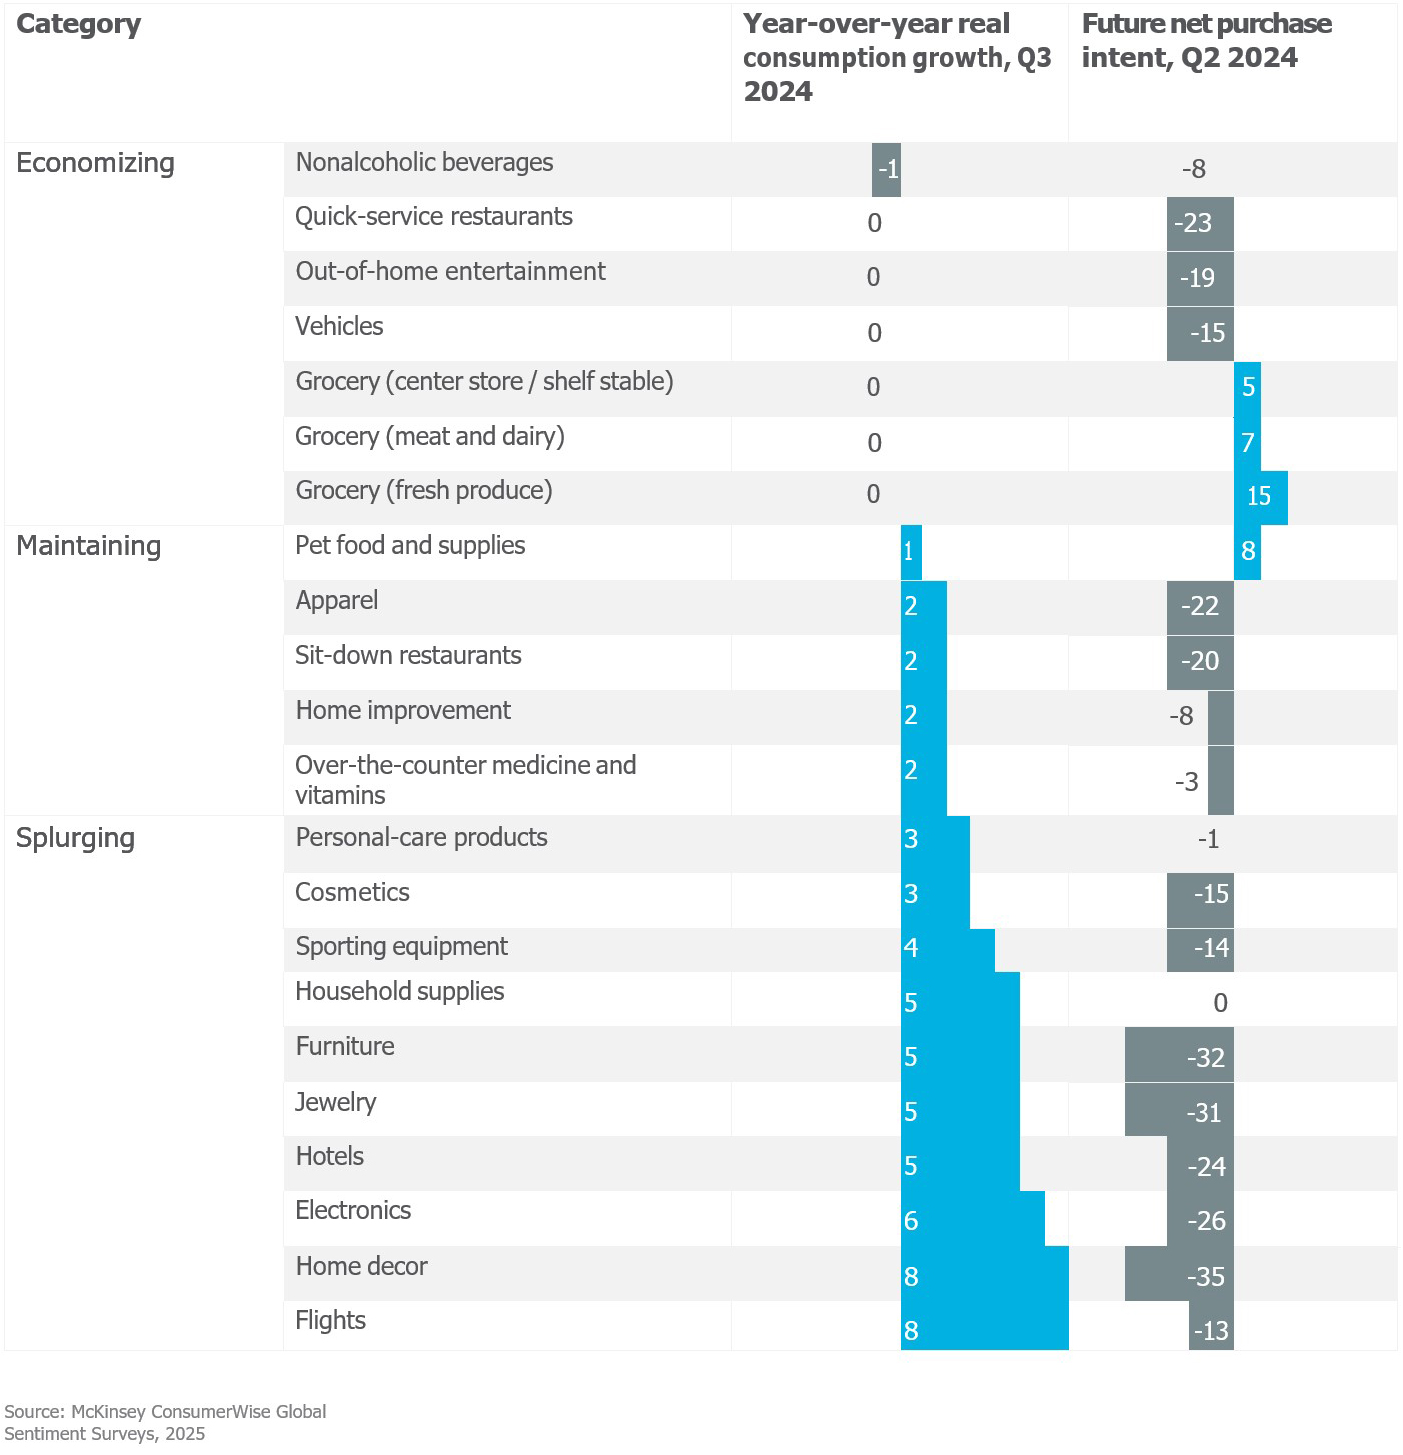
McKinsey & Company, is on track to becoming the largest and wealthiest group in history. By 2025, Gen Z household income had already surpassed that of Baby Boomers by roughly 50%, while their spending was expanding at nearly twice the pace. Looking ahead, by 2035, this generation is expected to add close to USD 8.9tn to the global economy, driven not only by rising income levels but also by a structurally higher propensity to spend and a greater willingness to use debt. With this in mind, let’s explore some sec-tors being reshaped by the new consumer trends.
On the real estate side, shopping malls are a pretty good reflection of how consumer behavior is shifting. What used to look like a dying format is resurging from the ashes, partly driven by growing tech fatigue and a renewed interest in in‑person experiences. Younger consumers, especially teens, are “mall-maxxing” their time, turning malls into social hang-outs rather than just shopping destinations. The con-trast is sharp: between 2017 and 2022, roughly 40 malls were closing every year in the U.S according to Capital One Shopping, and in 2022 alone, two million square feet, or the equivalent of almost 35 football fields of mall space was destroyed.
But momentum has improved more recently, with bet-ter foot traffic, stronger tenant sales, and occupancy
stabilizing. As an example, Simon Property Group, the largest shopping mall operator in the U.S., had a credit rating upgrade last year from S&P on the back of higher occupancy rates and record sales per square foot. Shopping malls are just one example of how commercial landlords are adapting to shifting consumer trends and behaviors. The broader com-mercial real estate space is finding its footing again, but not by going back to the old model. Instead, the recovery is taking shape through new formats that prioritize experience, flexibility, and mixed use over traditional single purpose assets.
On the healthcare side, while artificial intelligence has dominated recent headlines, the progress made by pharmaceutical companies in obesity control drugs (GLP1s) has been equally significant. This year marked a major inflection point for both Novo Nordisk (NVO) and Eli Lilly (LLY) with the FDA approval of oral doses of Wegovy and Foundayo. These new oral treatments target patients with lower BMIs, who are also needle‑phobic, and cost‑sensitive. Because these therapies are less invasive and more afford-able, they are being rapidly adopted by cost‑sensi-tive patients, who save an average of USD 50 per month compared with injectable versions. Although oral formulations are somewhat less effective, their popularity highlights that price sensitivity matters, even in healthcare.
While intuition might suggest that beer, fast‑food, or snack producers could benefit from more accessible obesity treatments, the reality is different. Major companies such as Coca‑Cola (KO) and PepsiCo (PEP) are already reshaping their strategies to align with evolving consumer habits, introducing smaller pack sizes, simplifying ingredient lists, and rebrand-ing major products. These treatments have revealed an important dynamic: consumers must make trade-offs. If they are already investing in expensive GLP1 therapies, they are less willing to undermine those efforts with unhealthy food or snacks.
With GLP1 adoption continuing to surge, and having already more than doubled by 2025, PwC now esti-mates that about 20% of U.S. households include at least one user of these treatments. In addition, EY-Parthenon estimates that related diet changes could eliminate up to USD 12bn in snack sales over the next decade. While companies are facing the challenges related to these treatments, the U.S. government has been putting more pressure with its Make America Healthy Again (MAHA) program. MAHA is reinforcing the shift to new consuming trends by prioritizing minimally processed foods and imposing sanctions to reduce the use of addi-tives, petroleum‑based dyes, added sugars, and ar-tificial ingredients. Together, economics, pharma-cology, and regulation are steering consumers toward healthier, simpler foods, leaving brands to adapt quickly to a market where wellness, trans-parency, and ingredient minimalism increasingly define demand.
The post pandemic consumer is rewriting the rules. Experiences beat possessions, convenience beats routine, and wellness has become a dominant eco-nomic force, even if the macroeconomic backdrop continues to present challenges to a still‑resilient consumer. With Gen Z’s spending power rising and regulation pushing cleaner choices, the winning categories will be the ones that adapt fast, simplify boldly, and meet consumers where their new priori-ties actually live.
Insigneo Financial Group, LLC comprises a number of operating businesses engaged in the offering of brokerage and advisory products and services in various jurisdictions. Brokerage products and services are offered through Insigneo Securities, LLC, a broker‑dealer registered with the U.S. Securities and Exchange Commission (“SEC”) and member of FINRA and SIPC. Investment advisory products and services are offered through Insigneo Advisory Services, LLC, an investment adviser registered with the SEC. Insigneo has affiliated companies in different locations, so it is important to understand which entity you are conducting business with. Please visit https://insigneo.com/legalentities/ for more information about the differences between these companies, their locations, and what that means for you.
This material should not be construed as an offer to sell or the solicitation of an offer to buy any security. It is for general information purposes only. To the extent that this material discusses general market activity, industry or sector trends or other broad‑based economic or political conditions, it should not be construed as research or investment advice. To the extent that it includes references to securities, those references do not constitute a recommendation to buy, sell or hold such security. It does not constitute a recommendation or a statement of opinion, or a report of either of those things and does not, and is not intended, to consider the particular investment objectives, financial conditions, or needs of individual investors. Any target prices provide reflect our current expectations, are subject to change and may not be achieved due to a variety of risks, including changes in economic conditions, interest rates, geopolitical developments, and issuer‑specific factors. The target price does not guarantee future results and should not be relied upon as a sole basis for investment decisions.
Not All Risks Are Disclosed – Past performance is not indicative of futures results. Investments involve significant risks, and it is possible to lose some or all of your principal investments and therefore may not be suitable for everyone. Always consider whether any investment is suitable for your particular circumstances and, if necessary, seek professional advice from your Investment Professional.
This material may contain opinions, expressions, and estimates that represent the analysis and perspective of Insigneo Securities, LLC’s Investment Strategy department or its providers at the time of publication. These are subject to change at any time, without notice.
FOR AFFILIATES LOCATED IN CHILE
Insigneo Asesorías Financieras SPA se encuentra inscrito en Chile, en el Registro de Prestadores de Servicios Financieros de la Comisión para el Mercado Financiero. Este informe fue efectuado por área de Research & Strategy de Insigneo Securities LLC. o sus proveedores, en base a la información disponible a la fecha de emisión de este. Para evitar cualquier conflicto de interés, Insigneo Securities LLC dispone que ningún integrante del equipo de Research & Strategy tenga su remuneración asociada directa o indirectamente con una recomendación o reporte específico o con el resultado de una cartera.
Aunque los antecedentes sobre los cuales ha sido elaborado este informe fueron obtenidos de fuentes consideradas confiables, no podemos garantizar la completa exactitud e integridad de estos, no asumiendo responsabilidad alguna al respecto Insigneo Securities LLC, Insigneo Asesorías Financieras SPA ni ninguna de sus empresas relacionadas.
Este material está destinado únicamente a facilitar el debate general y no pretende ser fuente de ninguna recomendación específica para una persona concreta. Por favor, consulte con su ejecutivo de cuentas o con su asesor financiero si alguna de las recomendaciones específicas que se hacen en este documento es adecuada para usted. Este documento no constituye una oferta o solicitud de compra o venta de ningún valor en ninguna jurisdicción en la que dicha oferta o solicitud no esté autorizada o a ninguna persona a la que sea ilegal hacer dicha oferta o solicitud. Las inversiones en cuentas de corretaje y de asesoramiento de inversiones están sujetas al riesgo de mercado, incluida la pérdida de capital.
La información base del presente informe puede sufrir cambios, no teniendo Insigneo Securities LLC ni Insigneo Asesorías Financieras SPA la obligación de actualizar el presente informe ni de comunicar a sus destinatarios sobre la ocurrencia de tales cambios. Cualquier opinión, expresión, estimación y/o recomendación contenida en este informe constituyen el juicio o visión de área de Research & Strategy de Insigneo Securities LLC. o sus proveedores, a la fecha de su publicación y pueden ser modificadas sin previo aviso.
FOR AFFILIATES LOCATED IN URUGUAY
Insigneo Asesor Uruguay S.A. está inscripto en el Registro de Mercado de Valores del Banco Central del Uruguay como Asesor de Inversiones. En Uruguay, los valores están siendo ofrecidos en forma privada de acuerdo al artículo 2 de la ley 18.627 y sus modificaciones. Los valores no han sido ni serán registrados ante el Banco Central del Uruguay para oferta pública. Este material está destinado únicamente a facilitar el debate general y no pretende ser fuente de ninguna recomendación específica para una persona concreta. Por favor, consulte con su ejecutivo de cuentas o con su asesor financiero si alguna de las recomendaciones específicas que se hacen en este documento es adecuada para usted según su perfil y estrategia de inversión. Este documento no constituye un asesoramiento ni una recomendación u oferta o solicitud de compra o. Las inversiones en valores negociables están sujetas al riesgo de mercado, incluida la pérdida parcial o total del capital invertido. Cualquier opinión, expresión, estimación y/o recomendación contenida en este informe constituyen el juicio o visión de área de Research & Strategy de Insigneo Securities LLC. o sus proveedores, a la fecha de su publicación y pueden ser modificadas sin previo aviso. Rentabilidades históricas de los productos anunciados no aseguran rentabilidades futuras.
FOR AFFILIATES LOCATED IN ARGENTINA
Insigneo Argentina S.A.U. Agente Asesor Global de Inversión se encuentra registrado bajo el N° 1053 de la Comisión Nacional de Valores (CNV) e inscripto ante la Inspección General de Justicia (IGJ) bajo el N° 12.278 del Libro 90, Tomo –, de Sociedades por Acciones. Este informe fue efectuado por área de Research & Strategy de Insigneo Securities LLC. o sus proveedores, en base a la información disponible a la fecha de su emisión. Para evitar cualquier conflicto de interés, Insigneo Securities LLC dispone que ningún integrante del equipo de Research & Strategy tenga su remuneración asociada directa o indirectamente con una recomendación o reporte específico o con el resultado de una cartera. Aunque los antecedentes sobre los cuales ha sido elaborado este informe fueron obtenidos de fuentes consideradas confiables, no podemos garantizar la completa exactitud e integridad de estos, no asumiendo responsabilidad alguna al respecto Insigneo Securities LLC, Insigneo Argentina S.A.U. ni ninguna de sus empresas relacionadas. La información base del presente informe puede sufrir cambios, no teniendo Insigneo Argentina S.A.U. la obligación de actualizar el presente informe ni de comunicar a sus destinatarios sobre la ocurrencia de tales cambios.
Este material está destinado únicamente a facilitar el debate general y no pretende ser fuente de ninguna recomendación específica para una persona concreta. Por favor, consulte con su ejecutivo de cuentas o con su asesor financiero si alguna de las recomendaciones específicas que se hacen en este documento es adecuada para usted. Este documento no constituye una oferta, recomendación o solicitud de compra o venta de ningún valor negociable en ninguna jurisdicción en la que dicha oferta o solicitud no esté autorizada o a ninguna persona a la que sea ilegal hacer dicha oferta o solicitud. Las inversiones en valores negociables están sujetas al riesgo de mercado, incluida la pérdida parcial o total del capital invertido. Cualquier opinión, expresión, estimación y/o recomendación contenida en este informe constituyen el juicio o visión de área de Research & Strategy de Insigneo Securities LLC. o sus proveedores, a la fecha de su publicación y pueden ser modificadas sin previo aviso.

