

June 26, 2026

The space economy has moved from science fiction to investable infrastructure. The SpaceX IPO is the catalyst, but the real opportunity extends far beyond one company, across satellites, launch capacity, defense, communications, spectrum, data, robotics, power, semiconductors, and sovereign industrial policy.
“Space Beyond SpaceX” is ultimately a story about scarcity. In an era when AI may make intelligence increasingly abundant, the scarce assets become physical: compute, power, grid capacity, spectrum, orbital infrastructure, secure communications, and launch capability.
Our Q2 call to fade Iranian war-related geopolitical risk has largely worked. The Middle East remains dangerous and Hormuz remains strategically critical, but the second derivative of geopolitical fear has fallen. Markets have moved from panic to pricing, allowing risk assets to recover despite the conflict.
The U.S. macro backdrop is benign and improving. Our recession probability for the balance of 2026 has fallen to 15%, supported by resilient labor markets, stable credit conditions, recovering risk appetite, and the growing contribution of AI-related capital spending to nominal growth.
We remain constructive on equities and are raising our S&P 500 year-end target from 7,600 to 7,800. The upgrade reflects stronger earnings momentum, record-level margins, and improving macro conditions, while recognizing that much of the easy geopolitical risk rebound has already occurred.
This is not simply a replay of the 2000 technology bubble. Valuations are elevated, but today’s market leaders generate substantial earnings, free cash flow, and margin expansion. Recent equity returns have been driven more by earnings growth than by multiple expansion, which makes the market vulnerable but not obviously irrational.
AI is now a macro variable, not just a technology theme. Hyperscaler capex, semiconductors, memory, data centers, grid equipment, cooling, gas turbines, cybersecurity upgrades, and critical minerals are becoming part of the business cycle itself. When a handful of companies spend hundreds of billions of dollars annually, micro becomes macro.
The AI buildout is a physical-investment cycle. The key bottlenecks are no longer only models and software; they are power availability, transformers, switchgear, land, construction labor, interconnection timelines, and electricity demand. The winners are likely to include the owners and suppliers of scarce infrastructure.
Space is the next layer of the AI and defense infra-structure stack. The space economy connects AI, national security, communications, earth observation, weather intelligence, maritime monitoring, sovereign autonomy, and real assets. Publicly traded space equities remain small relative to the scale of the opportunity, creating potential for a broader sector re-rating.
Our portfolio stance is risk-on, but with quality control. We favor U.S. equities, select AI-linked emerging markets, high-quality growth, semiconductors, data-center infrastructure, defense, power, grid equipment, energy security, and real-asset beneficiaries of reshoring and sovereign industrial policy.
The biggest near-term risk is a Fed policy mistake.
The danger is that the Fed misreads supply-driven inflation from oil, electricity, housing scarcity, and infrastructure bottlenecks as excessive demand, and hikes into a cycle that does not require additional monetary tightening.
The biggest long-term risk is political backlash. AI and space are creating enormous wealth while lower- to middle-income households face affordability pressures in housing, insurance, healthcare, education, and utilities. That raises the risk of higher corporate taxes,
capital-gains taxes, top income-tax rates, AI or data-center levies, and new wealth-tax proposals.
The central investment challenge is to own the next infrastructure layer without ignoring re-entry risk. The economy can keep climbing if the Fed avoids a mistake, AI capex continues translating into earnings, and policymakers do not respond to technological abundance with punitive taxation or regulatory overreach.
The record-setting SpaceX IPO has done more than open a new public-market chapter for the world’s most impor-tant private space company. It has crystallized a larger investment regime. The space economy is no longer a distant optionality trade, nor is it merely a launch-services story. It is becoming a platform economy, a national-se-curity architecture, a data-and-connectivity layer, and potentially the next frontier for AI infrastructure. In that sense, “Space Beyond SpaceX” is not a contradiction. It is the point. SpaceX may be the catalyst, the ticker, and the cultural event, but the investable opportunity (and the risk) extends across satellites, defense, power, semicon-ductors, robotics, communications, real assets, and sove-reign industrial policy.
This quarterly arrives with an important mark-to-market on our own prior thesis. In Q2, we argued that Iranian war-related geopolitical risk should be faded, not because the conflict was irrelevant, but because markets price the change in risk more than the absolute level of risk. That call has largely played out. Oil risk remains, Hormuz is still strategically central, and the Middle East has not become Switzerland. But the second derivative of geopolitical fear has fallen. The result has been a sharp recovery in risk assets, consistent with the old market lesson that when
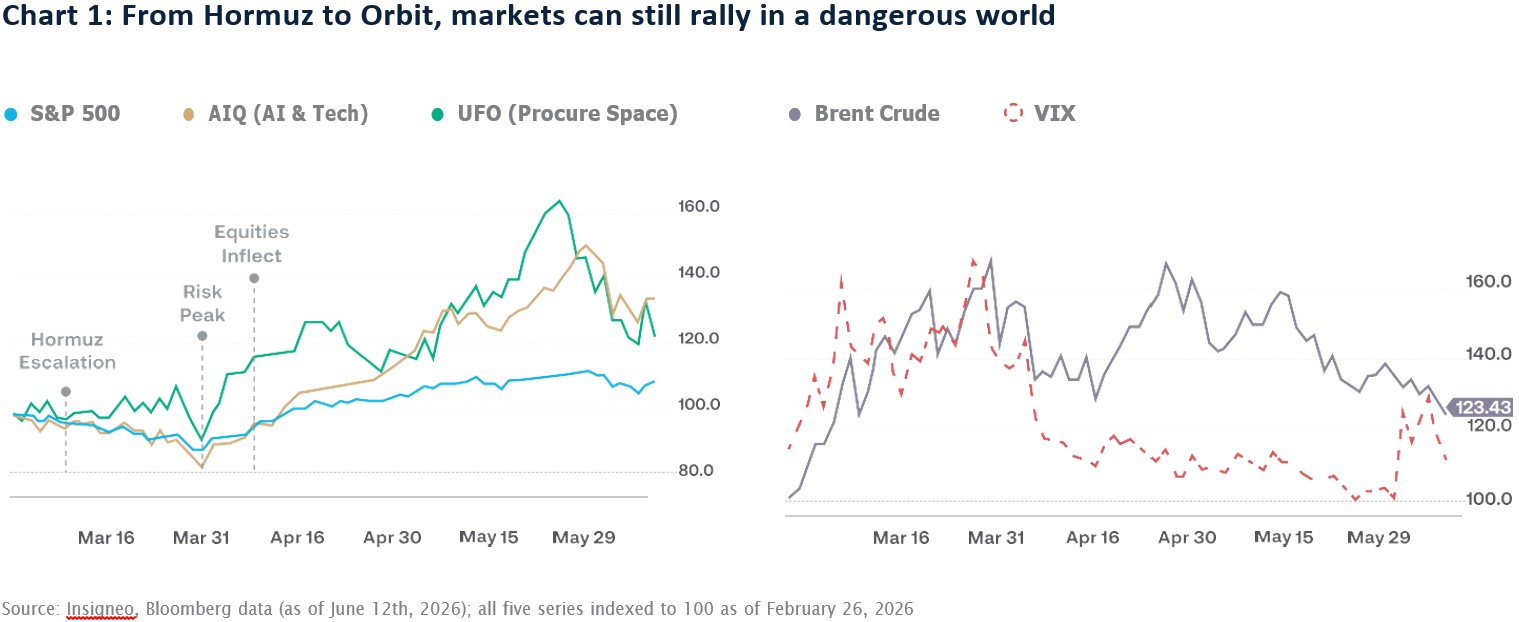
existential scenarios fail to materialize, positioning matters as much as geopolitics. Chart 1, “From Hormuz to Orbit,” is a visual reminder that markets can rally while the world remains dangerous. In the initial phase, Brent oil prices surged by 67% and the VIX spiked by 65%. The broader equity market experienced an orderly but meaningful drawdown. But then on April 8th (let us call it “Inflection Day” in a Trumpian nod), we saw the sharpest single-day reversal in equities. AIQ and UFO, both proxies for AI- and space-related themes, respectively, rallied strongly. By June 12th, the day SpaceX first traded publicly, with Brent still +23% above its starting level and the VIX at 95 indexed (still elevated), equities continued to trade higher. Equities did not just survive a dangerous world – they thrived in it.
The deeper story, however, is that the AI age is no longer theoretical. It is visible in orders, earnings, capex guidance, and corporate margins. The debate has moved from “is AI real?” to “where do the revenues accrue, who finances the buildout, and what physical bottlenecks matter most?” Company results increasingly show that earnings – and not multiple expansion – are doing much of the work. At the same time, the AI supply chain is becoming more physical: power availability, grid interconnection, data centers, memory, advanced chips, cooling, transformers, and increasingly satellites. This is why space belongs in the same conversation as AI. If intelligence becomes abundant but power, launch capa-city, secure communications, and orbital infrastructure remain scarce, the value migrates toward the owners and financiers of scarce physical capacity.
In Chart 2, “The AI-Space Capital Stack,” we compare current and estimated hyperscaler capex and the space-economy TAM to show how rapidly the market is re-rating the infrastructure behind intelligence and space. The two curves tell the same story from different vantage points. Hyperscaler capex inflects sharply after 2022, from USD 119B to nearly USD 900B in eight years, as the market prices in the compute requirements of AI at scale. The Space Economy TAM line rises in parallel, from USD 370B in 2020 toward USD 1.8T by 2035, as orbit becomes the next layer of the intelligence infrastructure stack.
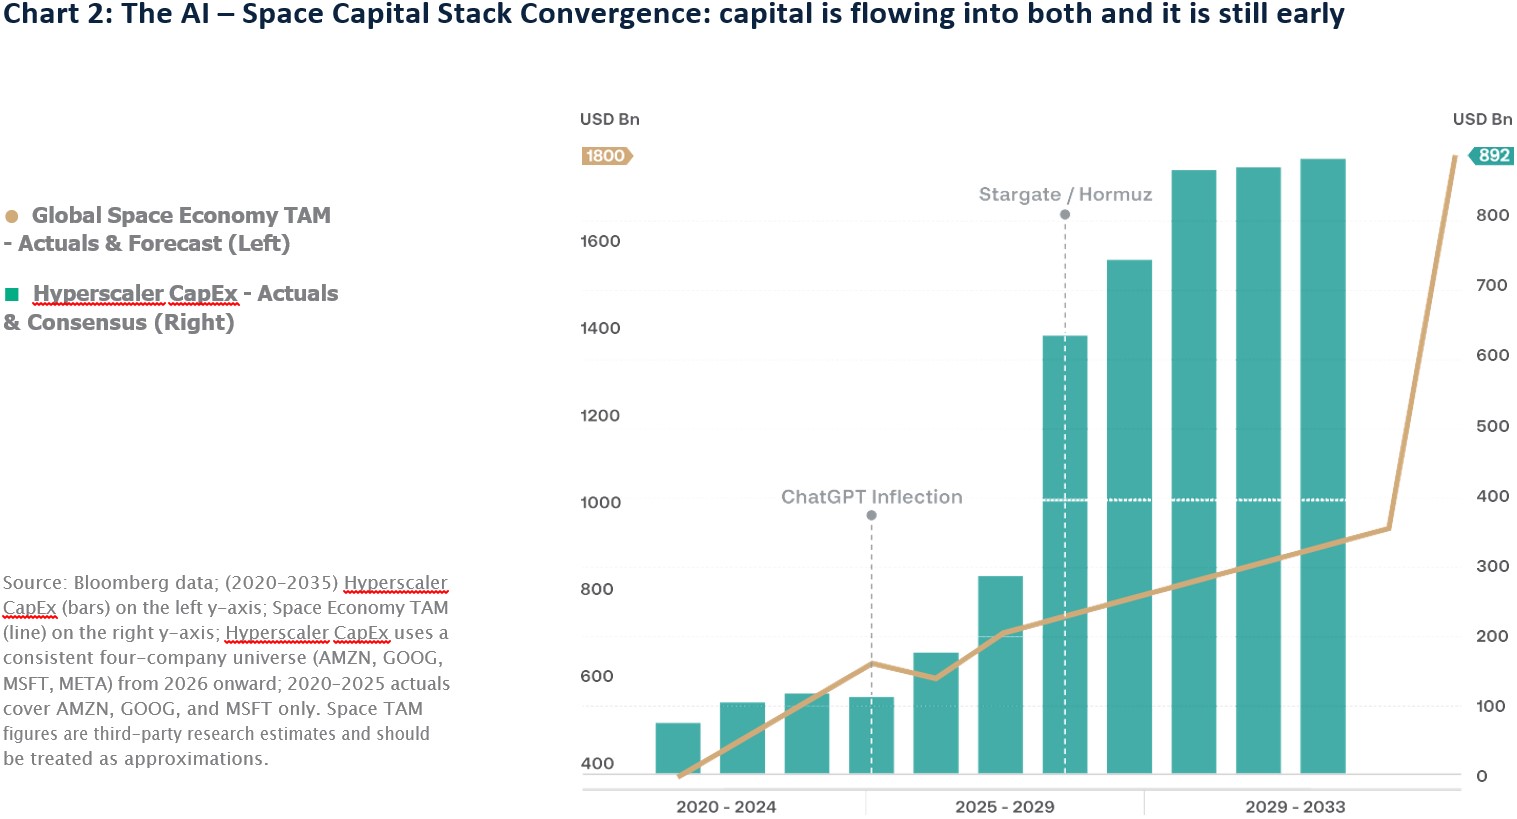
The convergence of the two curves is the main argu-ment: capital is flowing into both simultaneously, and the re-rating is still early.
Yet every new frontier creates a new politics. The SpaceX IPO has now minted the world’s first trillionaire, a miles-tone that may matter as much in Washington as on Wall Street. The political economy of abundance has a paradox. The more successful AI and space become, the more visible the concentration of gains becomes. That raises the probability that the next phase of the U.S. fiscal debate includes higher corporate taxes, higher capi-tal-gains taxes, higher top individual income-tax rates, targeted levies on AI or data-center revenues, and new versions of wealth taxation. The market may celebrate a trillionaire, but surveys are now suggesting that redistributive rhetoric from the populist left and right is gaining traction. The median voter may not be as enthused as the “besties” from the All In Podcast.
For portfolios, the conclusion is not to abandon risk, but to be more deliberate about which risks to own. The same forces tying together Hormuz, AI, SpaceX, defense, energy, and tax policy point to a world where micro is macro, capital intensity is strategic, and diversification without a thesis can become a mirage. The space economy is rising because the 21st-century economy needs a new layer of infrastructure above the Earth. The opportunity beyond SpaceX is to identify the public and private assets that make that layer possible, and to understand the political, fiscal, and market conse-quences of its success.
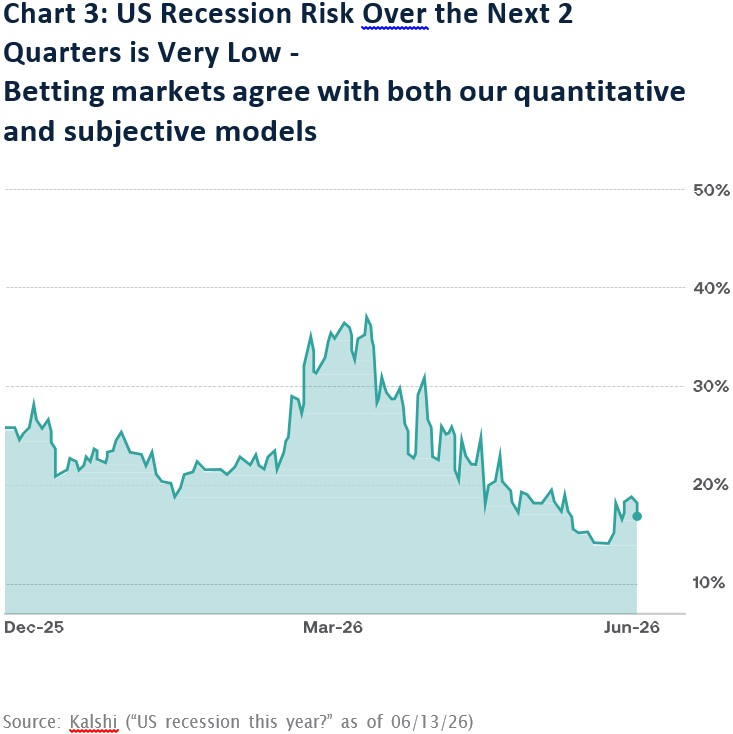
The global macroeconomic backdrop entering Q3 looks materially better than it did at the height of the spring geopolitical shock. Our U.S. recession probability for the balance of 2026 has fallen to 15% from 30%, reflecting three related developments: the fading of the most acute Iranian-war risk premium, resilient labor and consumption data, and the increasingly visible contribu-tion of AI-related capital spending to earnings and nominal growth. This does not mean the cycle is risk-free. It means the base case has improved. The economy is no longer flying through a clean atmosphere, but the turbulence is now manageable enough that portfolios should remain positioned for continued expansion rather than imminent recession. Both of our proprietary quanti-tative and subjective models agree that US recession risks remain well anchored. And as Chart 3 shows, when prediction markets converge into our figures, it gives us greater conviction with our forecasts. But it is not just our models or betting markets. Credit spreads, the unemployment rate, and risk markets themselves are illustrating how recession risk has repriced lower as financial conditions and earnings have stabilized.
The most important macro call from last quarter was that geopolitical risk around Iran should be faded. That view has largely played out. The point was never that the Middle East had become benign, or that energy choke-points no longer mattered. It was that markets often responded more to the second derivative of risk than to its absolute level. When the worst-case scenario fails to arrive, risk assets can recover even while the world remains dangerous. That is exactly what occurred. Oil remains elevated (above prewar levels but well below the highs during the conflict), Hormuz remains strategically central, and energy security has become an invest-able theme rather than a headline risk. But the market has moved from panic to pricing.
The market outlook is therefore constructive, but not indiscriminate. We are raising our S&P 500 year-end target from 7,600 to approximately 7,800. This is not a heroic upgrade. It is a disciplined adjustment based on improving earnings growth set against elevated rates and a strong rally through mid-June. In other words, we remain positive on equities, but much of the easy geopolitical-risk rebound has already occurred. From here, earnings, not multiple expansion, must do more of the lifting.
That earnings foundation remains the strongest argument against the idea that this is simply a 2000-style technology bubble in a different guise. U.S. corporate earnings have continued to surprise positively, profit margins are near record highs, and the AI complex is beginning to show up not just in narratives, but in orders, capex guidance, revenue run-rates, and earnings revisions. The more useful comparison is not Nasdaq price levels today versus Nasdaq price levels in 2000.
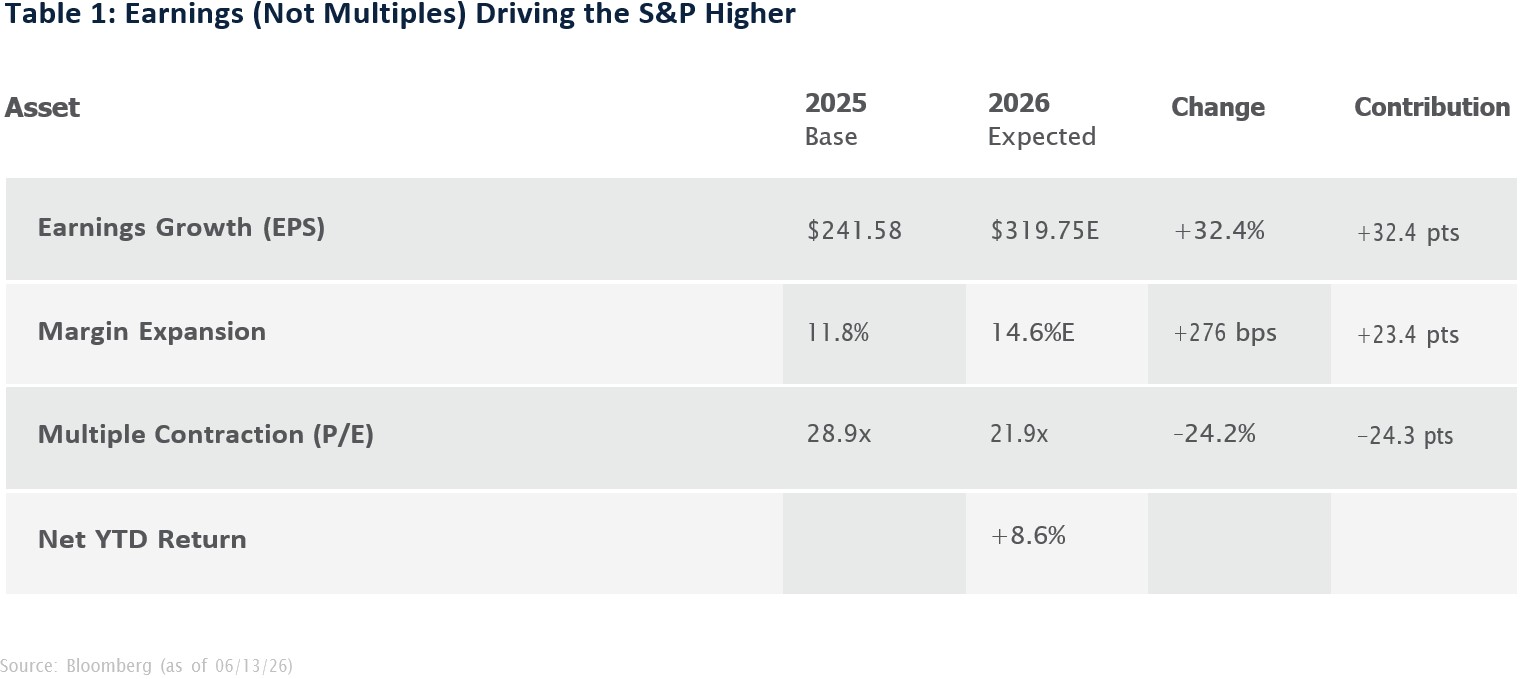
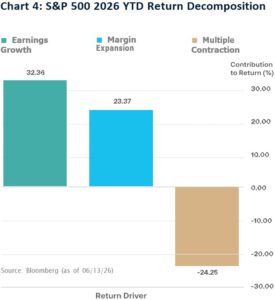 The most useful comparison is valuation relative to earn-ings durability. Consider the following: the S&P 500 is up approximately +8.6% YTD as of June 12th, 2026. The return decomposition reveals a striking tug-of-war: powerful fundamental improvement is being partially offset by significant multiple compression. As Table 1 suggests, margin expansion is the primary engine behind EPS growth. The 276 bps improvement in net profit margin (11.8% → 14.6%) is driving the bulk of the +32% earnings lift. Multiple contraction from 28.9x to 21.9x has absorbed most of that fundamental tailwind, leaving a modest net price gain. Chart 4 presents this graphically, so we can observe that earnings growth and margin expansion are doing the heavy lifting. In fact, the market has been able to return a modest gain so far despite multiple contraction driven by tightening financial conditions. Before the conflict in Hormuz, fed funds futures priced in two rate cuts this year; as of June 13th, they are now pricing in a rate hike, which is over 75 bps of movement in the forward curves.
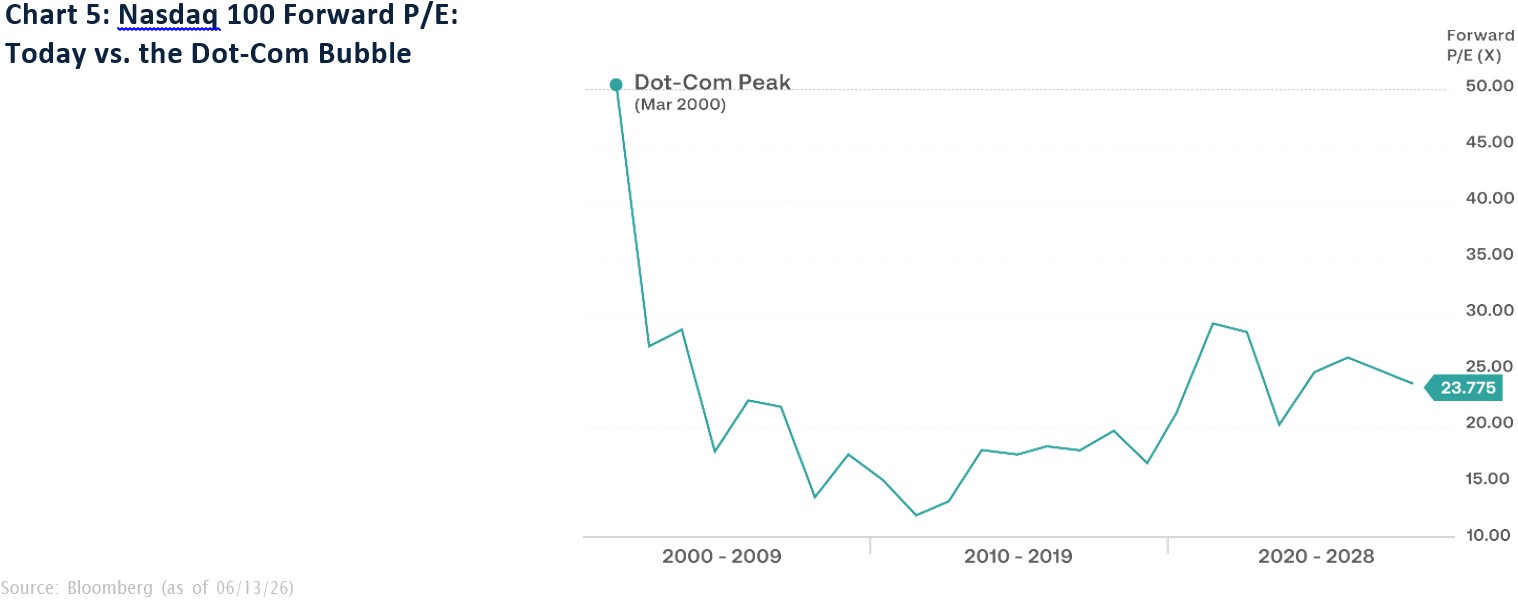
It is also worth comparing today’s Nasdaq forward P/E to the extreme valuations of the late-1990s bubble. The NDX currently trades at approximately ~24–25x forward earnings — elevated relative to its post-bubble history, but materially below the extremes of the late-1990s bubble, where the index briefly exceeded 50x in 2001 (already well off the peak). The dot-com peak in March 2000 was accompanied by forward multiples that were effectively incalculable for many index constituents, as earnings were negligible or negative. As Chart 5 demon-strates, there are material differences from 1999-2000. Today’s Nasdaq mega-caps (MSFT, AAPL, NVDA, META, GOOGL) generate substantial real earnings and free cash flow, unlike the largely pre-revenue dot-com cohort. At ~24x, the NDX is roughly half the multiple seen at the dot-com peak, though still above its 2010–2018 range of 15–22x. The S&P 500’s own multiple compression from 28.9x → 21.9x in 2026 suggests the market is actively re-rating growth assets, moving directionally away from bubble-era excess. Overall, the conclusion should be that valuation risk exists, but earnings support is real. Of course, AI is now the central macro variable. That sounds exaggerated until one looks at the scale of the capital cycle. Hyperscaler capex, semiconductors, memory, data centers, grid equipment, cooling systems, natural gas turbines, nuclear optionality, fiber, critical minerals, and satellite connectivity are no longer narrow technology subsectors. They are macro infrastructure.
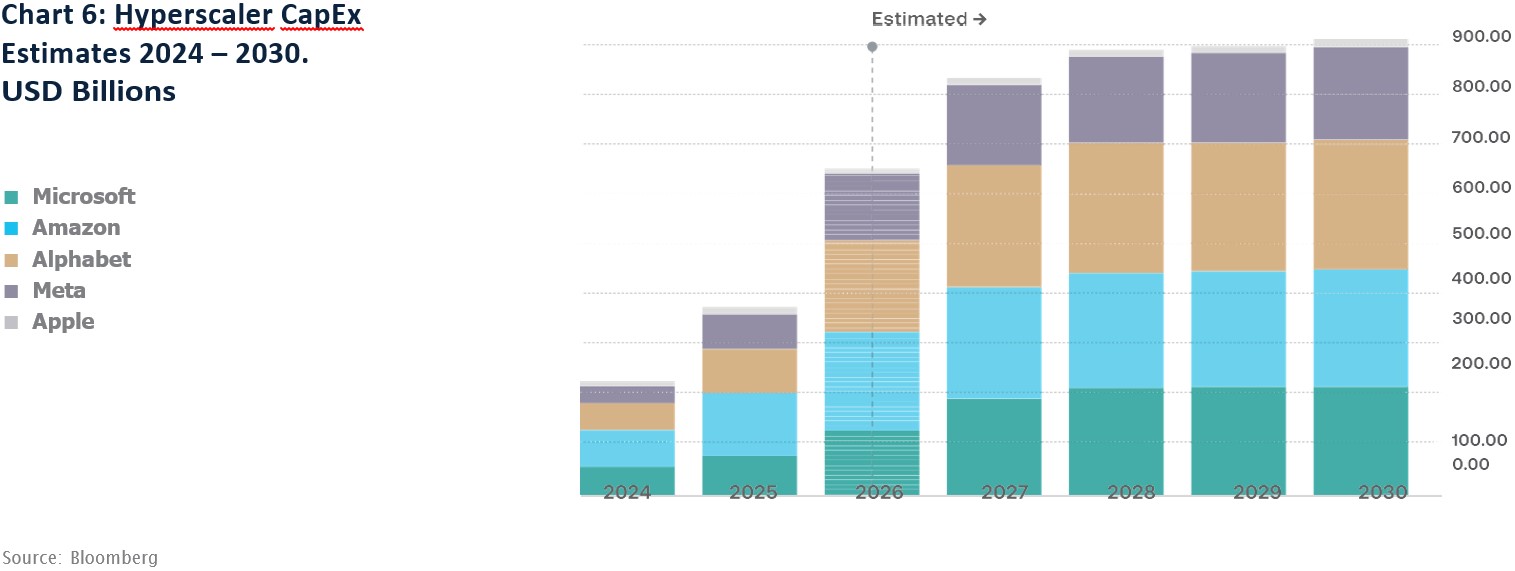
This is why the phrase that “micro is macro” is so prescient. When a handful of firms spend hundreds of billions of dollars per year, their investment decisions become part of the business cycle. As shown in Chart 6, consensus estimates show the five largest hyperscalers (Microsoft, Amazon, Alphabet, Meta, Apple) scaling combined annual capex from ~USD 218B in 2024 to nearly USD 907B by 2030, a four-fold increase in six years. Amazon and Alphabet are the largest individual spenders, each projected to exceed USD 260B annually by 2030. Amazon, Google, Meta, and Microsoft collectively plan to spend over USD 600B on AI hardware and data center infrastructure in 2026 alone, a ~60% increase from 2025. These four hyperscalers will spend nearly USD 4 trillion on data-center capex between 2026 and 2030. In fact, data center capex now accounts for approximately 10% of US private investment, a twenty-fold increase from a decade ago.
 And Meta’s capex-to-revenue ratio is estimated to reach ~54% in 2026E, up from 23% in 2024, which is a striking illustration of how capital-intensive this cycle has become.
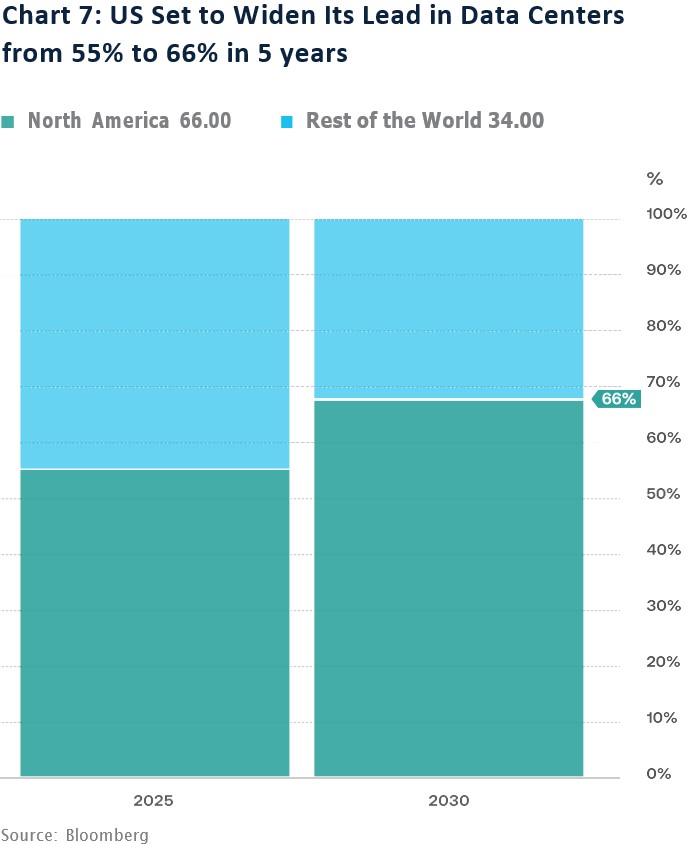
This is also a geographical bet. As demonstrated in Chart 7, North America’s share of global data center electrical-equipment spending is projected to rise from 55% in 2025 to 66% by 2030, widening its lead over the rest of the world, driven by hyperscaler scale, capital markets depth, power availability, and US AI policy. Roughly three-quarters of the +23 GW of data center capacity under construction globally at the end of September 2025 was in the US. The US also holds a USD 1.3 trillion data center construction pipeline — the largest in the world. Finally, US data-center power demand is expected to triple to 430 TWh by 2035, representing 6 to 10% of total US power demand. Interestingly, and unbeknownst to many, the Americas, including Latam, account for approximately 80% of all data center capacity currently under construction globally.
The constraints binding this investment cycle are emphatically physical. Nearly half of planned US data center projects face delays. Not from lack of capital, but from shortages of transformers, switchgear, and grid capacity, with transformer lead times extending to 128 weeks. Importantly, data center investment in 2025 surpassed global oil supply investment, a landmark crossover.
The AI build-out is structurally anchored to land, power, steel, and silicon and not just code. The capital commitment through 2030 rivals the largest infrastructure cycles in modern history. An additional 362 GW of power plant capacity will be required by 2035 to meet data-center demand alone. US data-center electricity demand is expected to roughly double by the end of this decade. In sum, the AI boom is not just a software cycle; it is a physical-investment cycle.
The same logic pulls the space economy into the market outlook. “Space Beyond SpaceX” is not merely a thematic slogan. It is part of the same scarcity economy that now defines AI: scarce power, scarce compute, scarce spectrum, scarce launch capacity, scarce secure communications, scarce orbital infrastructure, and scarce sovereign
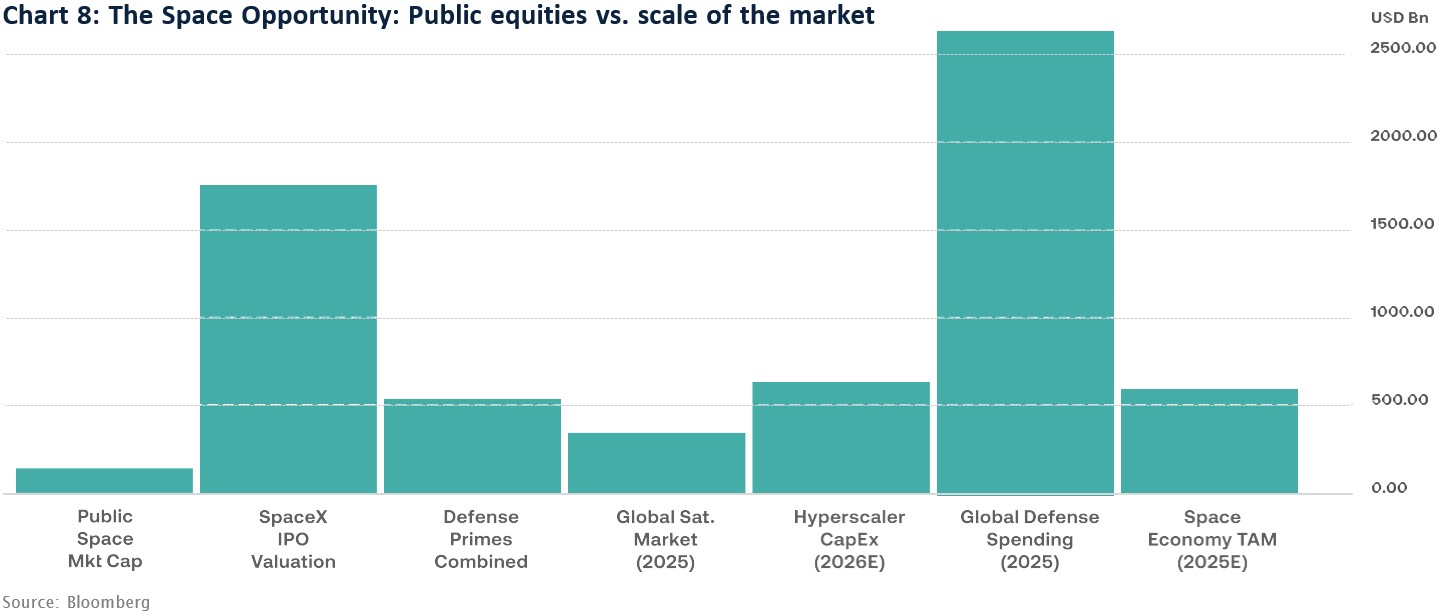
technological autonomy. The recent SpaceX IPO has made the space economy visible to public-market investors, but the opportunity is broader than one company. Space sits at the intersection of defense, communications, data, logistics, AI inference at the edge, earth observation, weather, maritime monitoring, sovereign security, and real assets. Chart 8 frames the core asymmetry: the entire publicly traded space sector (USD 135B) is barely visible against the benchmarks that define the opportunity around it. The public space equity market is structurally undersized relative to the sector’s revenue base, TAM trajectory, and the capital being deployed around it. SpaceX’s IPO instantly makes it the most valuable space asset by a wide margin and could serve as a re-rating catalyst for the broader sector.
For asset allocation, the implication is risk-on with quality control. We prefer U.S. equities, select emerging-market equities tied to AI supply chains and commodity exports, high-quality growth, semiconductors, data-center infra-structure, defense, power, grid equipment, and selected real-asset beneficiaries of energy security and reshoring.
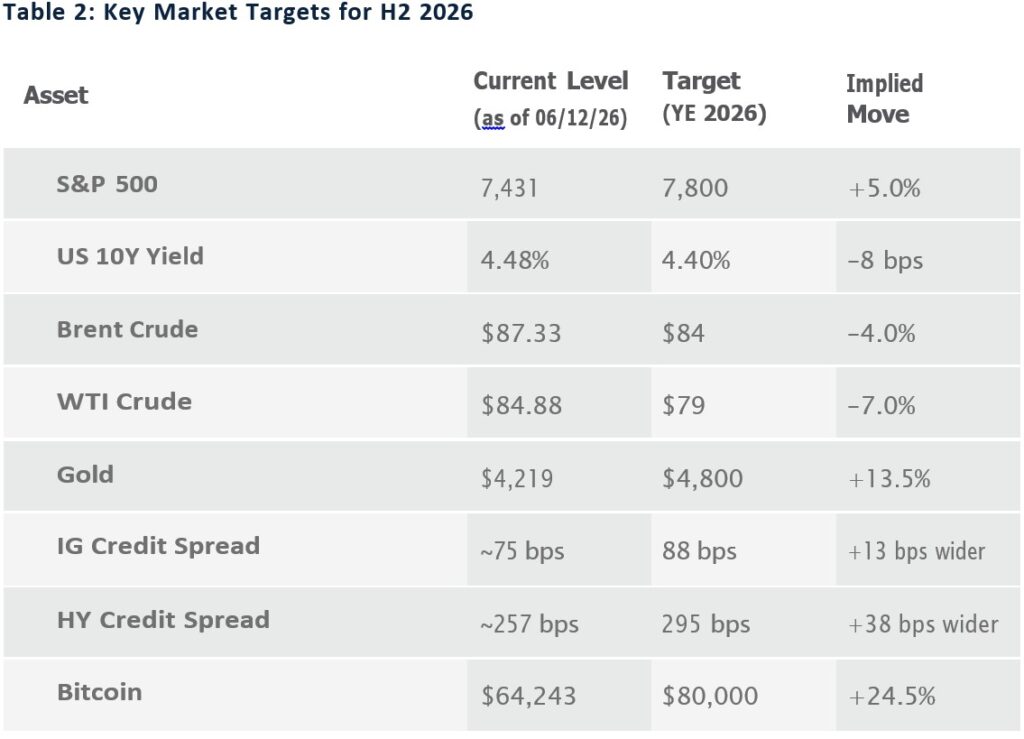 We also see opportunities in LatAm and other emerging markets where AI, energy, and multipolar supply-chain themes intersect. Credit is more nuanced. Fundamentals are solid, but spreads are tight and AI-related bond issuance could pressure parts of the investment-grade market. Table 2 highlights our key forecasts for major asset classes for the remainder of the year.
For us, always top of mind is how could our base case view be wrong? For the remainder of the year, the biggest policy risk is the Fed. A benign macro backdrop can be damaged by a central bank that mistakes supply-driven inflation for demand overheating. The risk is not merely that the Fed stays higher for longer; the bigger mistake would be hiking into a cycle where inflation pressure is coming from oil, electricity, data-center buildout, housing scarcity, and infrastructure bottlenecks rather than excessive house-hold demand. AI may ultimately be disinflationary through productivity, but the buildout phase is plausibly inflationary first. If the Fed reacts to that transition with excessive tightening, it could turn a manageable late-cycle expansion into an avoidable policy accident.
Over the long-run (from 2029 and beyond), the major risk is political backlash. AI and space are creating extraordinary wealth while lower- and middle-income households face affordability pressure in housing, insurance, education, healthcare, and electricity. A world that prints a new trillionaire while voters struggle with rent and utility bills is a world where tax risk rises. Corporate taxes, capital-gains taxes, top individual rates, AI or data-center levies, and wealth-tax proposals all become more politically plausible if the public concludes that the infrastructure of the next economy is enriching too few people too quickly. This is not an argument against owning the winners. It is an argument for recognizing that market leadership eventually becomes political exposure. AI-linked equi-ties can still appreciate, but higher taxes would likely trim the upside rather than end the cycle. Sam Altman may be reading the political room correctly by preemptively suggesting that the U.S. government take a 10% equity stake in OpenAI.
The Q3 launch sequence is therefore clear. Recession risk has fallen, earnings are strong, AI is real, space is becoming investable, and the geopolitical-risk premium has moderated. That supports a constructive market stance. But the flight path is narrowing. The economy can keep climbing if the Fed avoids a policy error, if AI capex continues to translate into earnings, and if polit-ical systems do not respond to technological abundance with punitive taxation or regulatory overreach. We want exposure to the next infrastructure layer of the economy. We also want enough discipline to remember that every successful launch still has a re-entry problem.


The space economy is shifting from a hardware-driven model to one where the greatest value comes from services and data, with total market size potentially reaching ~USD 1.8 trillion by 2035 and applications expected to surpass infrastructure in importance.
Growth is accelerating across the full value chain—from launches and satellites to in-orbit services and down-stream applications like communications, geospatial intelligence, and defense—with declining costs and rising private-sector participation driving scale.
Investment opportunities extend well beyond rocket companies, spanning satellite operators, component suppliers, materials manufacturers, and even data-processing firms that monetize space-enabled information, creating multiple ways to capture value.
The broader “space + AI” ecosystem is tightly linked to real assets such as energy, data centers, and water infra-structure, suggesting that indirect beneficiaries—particularly those supporting power and resource constraints—may be critical to sustaining long-term growth.
Please note: This material is provided for informational purposes only and does not constitute a recommendation or an offer to buy or sell any security. The companies discussed in this article operate in highly competitive, capital-intensive industries and may face risks including technological challenges, regulatory uncertainty, funding constraints, and market volatility. You are encouraged to contact your investment professional concerning any advice related to your investments.
On October 4, 1957, the Soviet Union launched Sputnik 1, the first artificial satellite to orbit Earth, marking the beginning of a new era of technological development. Nearly 70 years later, while discussions around space remain focused on humanity’s next frontiers beyond Earth, a new question has emerged: how can we capture economic value from space?
So, how big is space? Scientifically, we do not know, and we may never fully know. The observable universe has a diameter of approximately 93 billion light-years, representing the distance light has traveled since the beginning of the universe. Beyond that boundary, everything remains unknown. For markets, however, the opportunity is more measurable. According to the World Economic Forum (WEF), the global space economy could reach approximately USD 1.8 trillion by 2035, driven by techno-logical innovation, lower access costs, economies of scale, and increased availability of space-generated data.
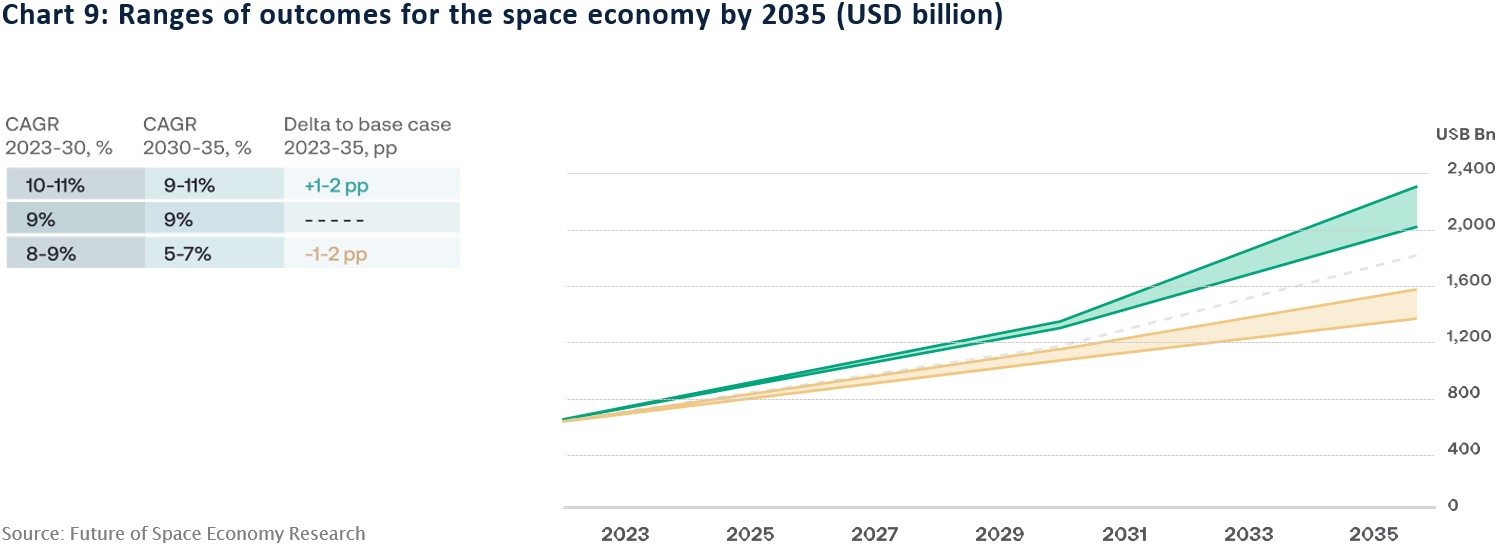
To understand this opportunity, the space economy can be divided into two broad categories: backbone and reach. Backbone represents the infrastructure that enables all space-based activities, including satellites, launch systems, software, and ground networks. Reach represents the applications built on top of this infrastructure, where space technology creates value across industries. In 2023, the global space economy was valued at approximately USD 630 billion, with backbone activities representing 52% of the market. However, some estimates suggest that a significant portion of future growth may come from reach applications. The WEF estimates that by 2035, reach could account for approximately 60% of the total market, high-lighting a fundamental shift: the future value of space will not be defined solely by the hardware we build, but by the services and insights generated from it.
The backbone and reach structure of the space complex resembles that of the oil and gas industry, where companies are divided into upstream (production), midstream (infrastructure), and downstream (end-market applications). Let us use a similar framework to explain the evolution of the space economy.
The upstream segment represents the physical founda-tion of the space economy, including launch systems, satellites, spacecraft components, and related infrastructure. Historically dominated by governments due to high costs and technological complexity, the sector has increasingly shifted toward commercial participation, as technology has improved, and launch costs have declined. The acceleration of commercial space activity is reflected in recent deployment trends. In 2025, the industry completed 325 orbital launches and deployed 4,544 spacecraft, representing respective increases of 25% and 54% compared with 2024. The United States accounted for nearly 60% of global launches, primarily driven by
commercial operators, while approximately 87% of launches were conducted by private companies.
Driven by demand for broadband connectivity and satellite networks, communication satellites represented the largest category of deployed spacecraft, accounting for approximately 83% of launches. Additionally, 98% of deployed spacecraft were small satellites weighing less than 1.2 tons, highlighting the industry’s transition toward lower-cost, scalable satellite platforms.
The midstream segment includes the services required to operate, maintain, and extend the useful life of assets already in orbit. This includes satellite servicing, in-orbit refueling, orbital logistics, commercial space stations, space traffic management, and debris removal. As the number of orbital assets continues to grow, these services will become increasingly important. At the same time, it is not surprising that the high cost of developing and launching spacecraft creates strong incentives to maximize asset utilization and extend operational lifetimes. Similar to aircraft maintenance in aviation, orbital services could become a recurring revenue opportunity, as space infrastructure becomes more valuable and widely deployed.
Downstream represents a potentially significant long-term opportunity because it captures the economic value generated by space-enabled applications. These activities can be divided into three main categories: satellite communications, Earth observation & geospatial intelligence, and defense applications.
Satellite communications represent one of the largest commercial opportunities, supporting broadband connectivity, aviation, maritime services, enterprise networks, and remote connectivity. As satellite networks expand, space infrastructure is increasingly becoming an alternative layer of global communications. Positioning, Navigation, and Timing (PNT) technology will also be a major growth driver. PNT enables location-based applications such as ride-hailing, logistics & last-mile delivery, asset tracking, and navigation services. Beyond consumer applications, highly accurate timing signals are also essential for financial markets, telecommunications networks, and critical infrastructure.
Earth observation and geospatial intelligence represent another significant opportunity. Satellite imagery and remote sensing data are increasingly used across agriculture, mining, energy, insurance, and climate risk management. As artificial intelligence improves the ability to analyze large datasets, the value of satellite information is expected to shift from selling raw imagery toward providing actionable insights and predictive analytics.
Finally, defense and national security will remain key contributors to the growth of the space market. Governments are increasing investment in satellite communications, intelligence, surveillance, missile warning systems, and space domain awareness as space becomes a strategic area of competition.
While backbone activities currently dominate the space economy, according to the WEF, the largest growth opportunity, the largest growth opportunity is expected to come from reach applications, projected to reach USD 1.03 trillion by 2035 – subject to variability in adoption rates and economic conditions. Within backbone, the largest markets are communications infrastructure, expected to rise to USD 218 billion by 2035, and PNT infrastructure, projected to climb to USD 120 billion, supported by rising demand for connectivity and location-based services. Additional opportunities include satellite manufacturing, which is expected to rise to USD 44 billion by 2035 as satellite deployments accelerate.
On the reach side, PNT-enabled applications represent the largest opportunity, projected to reach USD 799 billion by 2035, followed by communications applications at USD 133 billion, defense applications at USD 71 billion, and Earth observation applications at USD 10 billion. This growth will be driven by lower launch costs, increased satellite avail-ability, and the ability to transform space-generated data into actionable insights across industries such as transportation, agriculture, energy, insurance, and defense. As the space economy moves towards a scalable commercial market, the potentially significant long-term opportunities will depend on the companies that enable this transformation. However, growth could be constrained by higher launch costs, limited competition, restrictive regulations, space debris risks, or the adoption of terrestrial alternatives that reduce demand for certain space-based applications. These factors could limit investment and market expansion, potentially limiting the long-term growth and expansion of the space economy.
The next section examines the publicly traded “picks and shovels” of the space economy positioned to benefit from rising demand for launches, satellites, connectivity, and space-based services.
The rapid expansion of the commercial space economy has transformed rocket launches from a niche government activity into the backbone of a sprawling industrial ecosystem. Today, investors seeking exposure to this trend must look beyond rockets themselves and consider the full value chain: from launch providers to satellite operators, component manufacturers, advanced materials suppliers, and even data and computing firms. As launch cadence accelerates—driven by companies like SpaceX and a resurgence in government and commercial
demand—the companies best positioned to benefit are those embedded across this layered ecosystem.
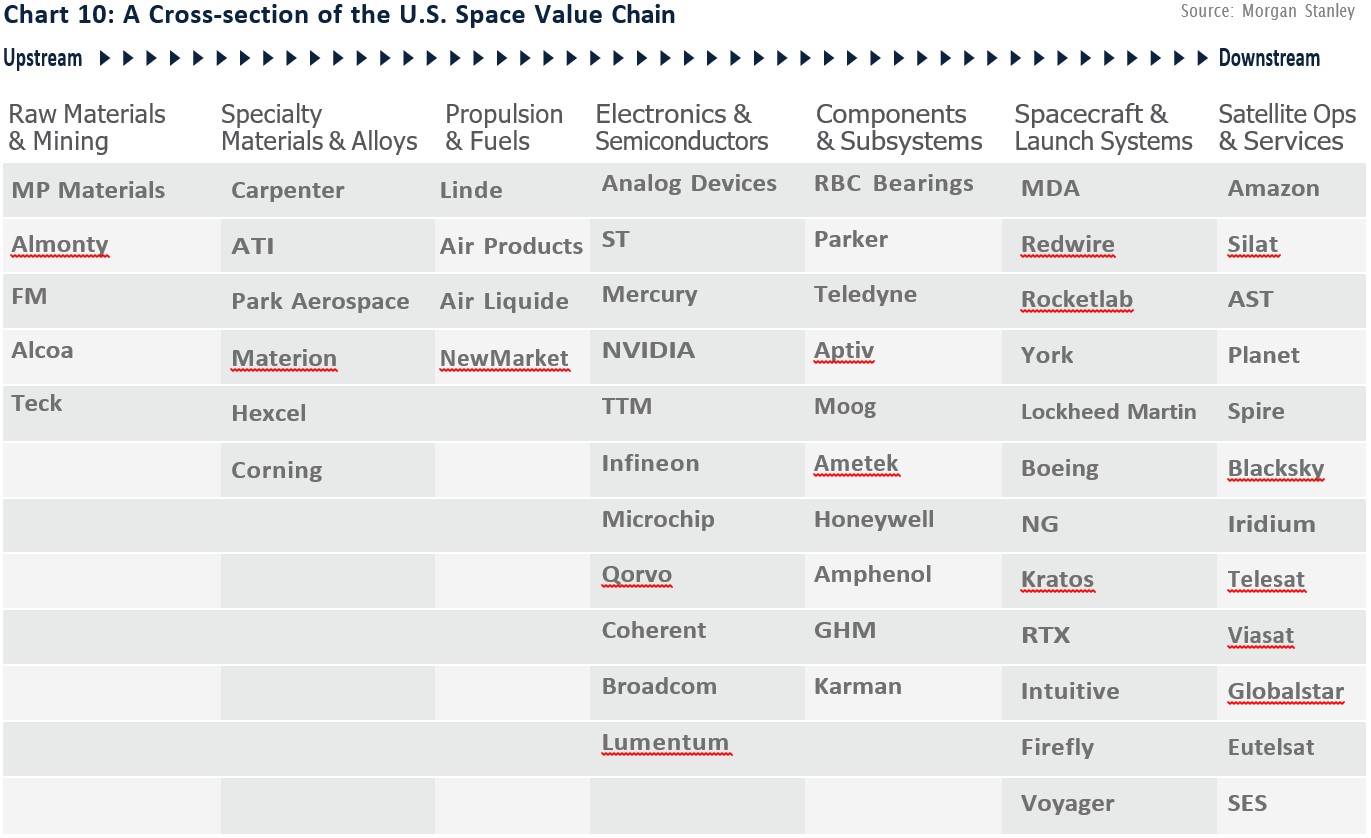
At the most direct level are the launch providers and spacecraft producers, the companies whose revenue is most tightly linked to rockets lifting off. Among publicly traded firms, Rocket Lab (RKLB) may be considered a ‘pure play’ space company based on its business model. It not only launches payloads with its Electron rocket but also manufactures satellites, builds spacecraft components, and is developing a reusable medium-lift vehicle called Neutron, giving it exposure across multiple stages of the space value chain. The company has reported
growth in revenue and backlog; a potential sign of increasing demand for launch services and integrated space systems. However, RKLB does operate in a capital-intensive and competitive market, which also entails significant execution risk.
Other players in this category include smaller companies such as Firefly Aerospace (FLY), which combines launch services with lunar missions, as well as legacy aerospace giants like Northrop Grumman (NOC) and Boeing (BA). These large defense contractors bring decades of experience in propulsion systems, heavy-lift rockets, and government contracts, including NASA’s Space Launch System (SLS). While they are less pure plays than newer entrants, their stable funding and deep institutional ties make them crucial beneficiaries of sustained launch demand.
However, focusing solely on rocket launches risks missing a broader, and in many cases a more lucrative, “midstream” segment of the industry: satellite operators and space-based service providers. Rockets are the enablers, but satellites generate recurring revenue streams. Companies such as AST SpaceMobile (ASTS) are building next-generation communications networks that connect directly to smartphones, while firms like Iridium Communications (IRDM) and Planet Labs (PL) provide global connectivity and Earth observation data. As launch costs decline and frequency increase, it becomes easier
and cheaper to deploy large constellations of satellites. This shifts value toward companies that monetize these assets over time, rather than those that conduct the launches themselves.
Beyond these visible players lies a critical tier of companies that supply the components, electronics, and subsystems that make spaceflight possible. These firms are often overlooked but play a central role in enabling the entire industry. Companies such as Moog (MOG) produce flight control systems and actuators, while Curtiss-Wright (CW) and Mercury Systems (MRCY) supply embedded computing and specialized electronics for space and defense applications. Meanwhile, Redwire (RDW) focuses on in-space manufacturing and mission-critical technologies, highlighting the growing importance of in-orbit capabilities. The advantage of these suppliers is diversification: they often sell to multiple launch providers, satellite manufacturers, and defense programs simultaneously. As a result, they benefit from the overall growth of the space economy without being dependent on a single platform or mission.
Even deeper in the value chain are the materials and advanced manufacturing companies that provide the physical building blocks of rockets and spacecraft. Rockets operate under extreme conditions—intense heat, pressure, and vibration—requiring specialized alloys, composites, and precision-engineered components. Firms like Howmet Aerospace (HWM) supply superalloy engine parts critical for rocket propulsion, while Hexcel (HXL) produces carbon fiber composites used in lightweight structural components. Other companies, including ATI (ATI) and Carpenter Technology (CRS), manufacture high-performance metals designed to withstand the harsh environments of launch and space operations.
These materials suppliers represent a classic “picks and shovels” investment: regardless of which launch company dominates, every rocket requires advanced materials.
As launch frequency increases—particularly with the push toward rapid reuse and high-volume production—demand for these inputs scales accordingly.
Finally, there is a layer of second-order beneficiaries that capture value created by space infrastructure rather than participating directly in launches. These include companies involved in satellite ground systems, data processing, and high-performance computing. For instance, Kratos Defense (KTOS) supplies satellite ground infrastructure that enables communication and control of constellations, while firms like Nvidia (NVDA) benefit from growing demand for computational power to process satellite data and support AI-driven applications. In addition, major technology platforms such as Alphabet (GOOGL) have financial stakes and strategic interests tied to the growth of space-based connectivity. This layer reflects a critical shift: as space becomes increasingly commercialized, the real value may lie not in reaching orbit, but in what happens afterward—data generation, communications, and infrastructure services.
Across all these layers, several macro trends are driving growth. The global space economy, already estimated at hundreds of billions of dollars, continues to expand rapidly as private investment, government spending, and technological innovation converge. The proliferation of low-Earth orbit (LEO) satellite constellations, the development of reusable rocket systems, and the increasing role of defense and national security applications all contribute to rising demand across the ecosystem. Within this framework, SpaceX (SPCX) is often cited in industry discussions for its vertically integrated approach spanning launch, satellite, and communications capabilities, though the extent of its long-term impact remains uncertain at this point in time.
However, the most compelling investment opportunities are rarely confined to a single company or segment. Pure-play launch companies offer high growth and
visibility but can be volatile and capital-intensive. Satellite operators provide recurring revenue and scalability, while suppliers and materials firms offer more stable, diversified exposure. Meanwhile, adjacent technology companies capture the downstream benefits of a data-rich, space-connected world.
Ultimately, investing in the future of rocket launches is less about picking a single winner and more about under-standing the interconnected system that makes space-flight possible, as well as the many implications that come with this new frontier. The companies best positioned to benefit are those embedded across the value chain—whether they are launching rockets, building satellites, supplying critical components, or enabling the data infra-structure that turns orbit into a profitable domain.
Much has been said about the AI and space frenzy in the investment landscape. Undeniably, these two phenomena continue to underpin the latest moves in global markets,
as investors remain laser-focused on AI and space developments by companies hoping to achieve liftoff beyond Earth. However, since life outside The Blue Planet has not yet been achieved, investment in real assets is surging as an attractive alternative for port-folio diversification without leaving the Milky Way. Hence, let us focus on how investing in real assets, specifically infrastructure and natural resources, may prove beneficial as we pursue interplanetary expansion.
Real assets are those whose intrinsic value is derived from physical properties. Some of their usual representatives are real estate, land, equipment, and infrastructure. One of the main characteristics of this asset class is its stability during inflationary periods; however, a key setback is that investing in real assets can be subject to liquidity constraints, as selling physical assets may be cumbersome. Still, it is worth noting that investors are turning to infrastructure as an alternative for diversification, as well as a reliable income stream, and an inflation hedge, as highlighted in the November 2025 Preqin survey of global institutional investors.
According to research from Capital Economics, most of the AI-related infrastructure spending is occurring in the U.S. Still, the main beneficiaries of this trend are countries that export AI-related capital goods, such as Taiwan and Mexico. Going forward, this trend is likely to persist amid an infrastructure build-out that should continue to boost investment in data centers, chips, related hardware, and energy capacity. Furthermore, as we mentioned before, the market expects hyperscalers’ capital expenditure to continue rising at an accelerated pace over the next couple of years. Additionally, and specifically in the U.S., the main energy source for data centers is natural gas – a commodity whose price has been less affected by the conflict in Iran and whose domestic supply is ample, further solidifying our thesis of a favorable environment for continued infra-structure spending in the near future. Against this back-drop, the observed surge in AI has brought an ever-growing need to supply the economy with additional power generation to meet increased electricity demand, thereby accelerating the need to build larger, more reliable energy infrastructure. Additionally, the observed electrification trends in transportation and heating are adding to power demand pressures that have only grown stronger amid the disruptions caused by the war in Iran. The power generation sector has gained relevance within the infrastructure universe, currently being the sector with the highest representation within the MSCI Global Private Quarterly Infrastructure Asset Index (57%).
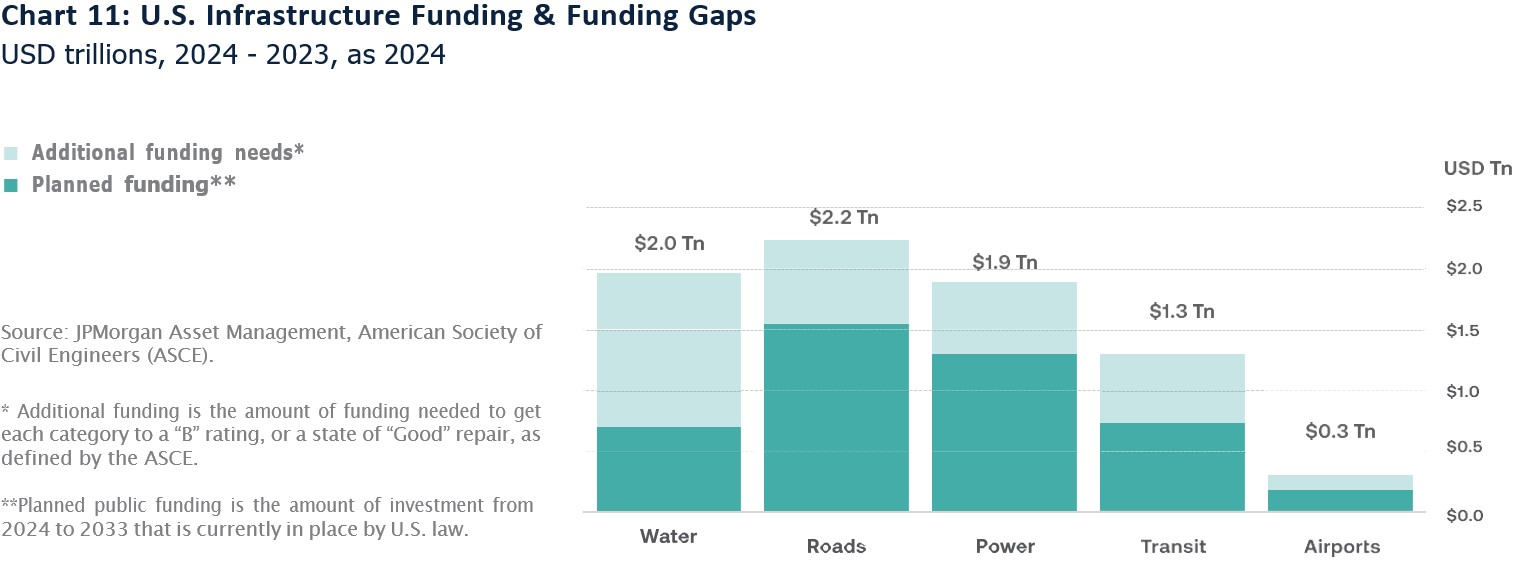
In contrast, water is the sector with the smallest representation in the index, at 6%. This marks a stark contrast with the latest figures of U.S. planned infrastructure funding and associated funding gaps that could potentially arise. According to data compiled by JPMorgan Asset Management, although planned funding for water infrastructure is the second lowest figure during the observed period, its additional funding needs are the second highest among the selected sectors Chart 11.
Although it may sound counterintuitive at first, investing in water infrastructure could prove beneficial for both the power and AI sectors.
For data centers, access to water is a binding constraint in the process of expansion or new construction. According to a report from Bloomberg Intelligence, about 40% of data center capacity could be in areas with serious water shortages, while accelerated AI adoption could add between 4 – 7 billion cubic meters to water withdrawals by 2027. Therefore, adequate resources and water management could be critical to future project approval, especially given that U.S. data center cooling needs could triple by 2028, per Bloomberg Intelligence.
Given that hyperscalers have the greatest absolute expo-sure to water stress, resource management becomes
critical for future project approvals. However, there could be a silver lining for the hyperscalers and the AI industry. According to estimates from the World Economic Forum, optimizing algorithms can reduce water usage in data centers by 25%, while implementing liquid-immersion cooling systems could save up to 90%. In this regard, it is worth highlighting Microsoft’s efforts since it began deploying zero-water cooling systems in August 2024.
In the power sector, the power-generating industry that requires the highest cooling-water intensity is coal, with more than six times the water-cooling needs of natural gas. Moreover, it is worth noting that neither solar nor wind energy involves water intensity or use. As water availability becomes less reliable due to climate change, more water-intensive power plants face greater shut-down risks, higher costs, and physical disruptions. Therefore, companies that develop alternative processes to obtain water, such as desalination, are becoming key players in this space, exemplified by the French company Veolia’s aim to design and offer water, waste, and energy management solutions. In that realm, the company reduced its desalination cost from USD 5 per cubic
meter in 1970 to less than USD 0.5 per cubic meter in 2024, at the same time driving down its energy intensity. Another example is OceanWell, which accounts for an energy-efficient subsea technology that enables the company to address waste challenges and is uniquely suitable for cooling data centers. This is relevant in geographies such as Cyprus and Malta, where water is scarce and at least 50% of the public water supply comes from desalination.
In the end, investing in space is not a single bet—it is a layered orbit. From the picks-and-shovels manufacturers building satellites and launch systems, to the infra-structure quietly wiring data back to Earth, to the head-line-grabbing ventures pushing humanity’s frontier, as well as the technologies protecting The Blue Planet’s natural resources that enable this unique infrastructure, each tier plays its own gravitational role. Together, they form an ecosystem where risk and reward do not just coexist; rather, they compound. The real insight is that the space economy is not just about reaching the stars; it is about understanding which parts of the journey generate returns along the way.
It is important to note that we are not endorsing any of these stocks for investment, just presenting some ideas for potential consideration. These stocks carry varying levels of risk, are not suitable for every investor, and are best evaluated on a case-by-case basis. Please feel free to reach out to your financial advisor with any questions.
Insigneo Financial Group, LLC comprises a number of operating businesses engaged in the offering of brokerage and advisory products and services in various jurisdictions. Brokerage products and services are offered through Insigneo Securities, LLC, a broker-dealer registered with the U.S. Securities and Exchange Commission (“SEC”) and member of FINRA and SIPC. Investment advisory products and services are offered through Insigneo Advisory Services, LLC, an investment adviser registered with the SEC. Insigneo has affiliated companies in different locations, so it is important to understand which entity you are conducting business with. Please visit https://insigneo.com/legalentities/ for more information about the differences between these companies, their locations, and what that means for you.
This material should not be construed as an offer to sell or the solicitation of an offer to buy any security. It is for general information purposes only. To the extent that this material discusses general market activity, industry or sector trends or other broad-based economic or political conditions, it should not be construed as research or investment advice. To the extent that it includes references to securities, those references do not constitute a recommendation to buy, sell or hold such security. It does not constitute a recommendation or a statement of opinion, or a report of either of those things and does not, and is not intended, to consider the particular investment objectives, financial conditions, or needs of individual investors. Any target prices provide reflect our current expectations, are subject to change and may not be achieved due to a variety of risks, including changes in economic conditions, interest rates, geopolitical developments, and issuer-specific factors. The target price does not guarantee future results and should not be relied upon as a sole basis for investment decisions.
Not All Risks Are Disclosed – Past performance is not indicative of futures results. Investments involve significant risks, and it is possible to lose some or all of your principal investments and therefore may not be suitable for everyone. Always consider whether any investment is suitable for your particular circumstances and, if necessary, seek professional advice from your Investment Professional. This material may contain opinions, expressions, and estimates that represent the analysis and perspective of Insigneo Securities, LLC’s Investment Strategy department or its providers at the time of publication. These are subject to change at any time, without notice.
FOR AFFILIATES LOCATED IN CHILE
Insigneo Asesorías Financieras SPA se encuentra inscrito en Chile, en el Registro de Prestadores de Servicios Financieros de la Comisión para el Mercado Financiero. Este informe fue efectuado por área de Research & Strategy de Insigneo Securities LLC. o sus proveedores, en base a la información disponible a la fecha de emisión de este. Para evitar cualquier conflicto de interés, Insigneo Securities LLC dispone que ningún integrante del equipo de Research & Strategy tenga su remuneración asociada directa o indirectamente con una recomendación o reporte específico o con el resultado de una cartera.
Aunque los antecedentes sobre los cuales ha sido elaborado este informe fueron obtenidos de fuentes consideradas confiables, no podemos garantizar la completa exactitud e integridad de estos, no asumiendo responsabilidad alguna al respecto Insigneo Securities LLC, Insigneo Asesorías Financieras SPA ni ninguna de sus empresas relacionadas.
Este material está destinado únicamente a facilitar el debate general y no pretende ser fuente de ninguna recomendación específica para una persona concreta. Por favor, consulte con su ejecutivo de cuentas o con su asesor financiero si alguna de las recomendaciones específicas que se hacen en este documento es adecuada para usted. Este documento no constituye una oferta o solicitud de compra o venta de ningún valor en ninguna jurisdicción en la que dicha oferta o solicitud no esté autorizada o a ninguna persona a la que sea ilegal hacer dicha oferta o solicitud. Las inversiones en cuentas de corretaje y de asesoramiento de inversiones están sujetas al riesgo de mercado, incluida la pérdida de capital.
La información base del presente informe puede sufrir cambios, no teniendo Insigneo Securities LLC ni Insigneo Asesorías Financieras SPA la obligación de actualizar el presente informe ni de comunicar a sus destinatarios sobre la ocurrencia de tales cambios. Cualquier opinión, expresión, estimación y/o recomendación contenida en este informe constituyen el juicio o visión de área de Research & Strategy de Insigneo Securities LLC. o sus proveedores, a la fecha de su publicación y pueden ser modificadas sin previo aviso.
FOR AFFILIATES LOCATED IN URUGUAY
Insigneo Asesor Uruguay S.A. está inscripto en el Registro de Mercado de Valores del Banco Central del Uruguay como Asesor de Inversiones. En Uruguay, los valores están siendo ofrecidos en forma privada de acuerdo al artículo 2 de la ley 18.627 y sus modificaciones. Los valores no han sido ni serán registrados ante el Banco Central del Uruguay para oferta pública. Este material está destinado únicamente a facilitar el debate general y no pretende ser fuente de ninguna recomendación específica para una persona concreta. Por favor, consulte con su ejecutivo de cuentas o con su asesor financiero si alguna de las recomendaciones específicas que se hacen en este documento es adecuada para usted según su perfil y estrategia de inversión. Este documento no constituye un asesoramiento ni una recomendación u oferta o solicitud de compra o. Las inversiones en valores negociables están sujetas al riesgo de mercado, incluida la pérdida parcial o total del capital invertido. Cualquier opinión, expresión, estimación y/o recomendación contenida en este informe constituyen el juicio o visión de área de Research & Strategy de Insigneo Securities LLC. o sus proveedores, a la fecha de su publicación y pueden ser modificadas sin previo aviso. Rentabilidades históricas de los productos anunciados no aseguran rentabilidades futuras..
FOR AFFILIATES LOCATED IN ARGENTINA
Insigneo Argentina S.A.U. Agente Asesor Global de Inversión se encuentra registrado bajo el N° 1053 de la Comisión Nacional de Valores (CNV) e inscripto ante la Inspección General de Justicia (IGJ) bajo el N° 12.278 del Libro 90, Tomo –, de Sociedades por Acciones. Este informe fue efectuado por área de Research & Strategy de Insigneo Securities LLC. o sus proveedores, en base a la información disponible a la fecha de su emisión. Para evitar cualquier conflicto de interés, Insigneo Securities LLC dispone que ningún integrante del equipo de Research & Strategy tenga su remuneración asociada directa o indirectamente con una recomendación o reporte específico o con el resultado de una cartera. Aunque los antecedentes sobre los cuales ha sido elaborado este informe fueron obtenidos de fuentes consideradas confiables, no podemos garantizar la completa exactitud e integridad de estos, no asumiendo responsabilidad alguna al respecto Insigneo Securities LLC, Insigneo Argentina S.A.U. ni ninguna de sus empresas relacionadas. La información base del presente informe puede sufrir cambios, no teniendo Insigneo Argentina S.A.U. la obligación de actualizar el presente informe ni de comunicar a sus destinatarios sobre la ocurrencia de tales cambios.
Este material está destinado únicamente a facilitar el debate general y no pretende ser fuente de ninguna recomendación específica para una persona concreta. Por favor, consulte con su ejecutivo de cuentas o con su asesor financiero si alguna de las recomendaciones específicas que se hacen en este documento es adecuada para usted. Este documento no constituye una oferta, recomendación o solicitud de compra o venta de ningún valor negociable en ninguna jurisdicción en la que dicha oferta o solicitud no esté autorizada o a ninguna persona a la que sea ilegal hacer dicha oferta o solicitud. Las inversiones en valores negociables están sujetas al riesgo de mercado, incluida la pérdida parcial o total del capital invertido. Cualquier opinión, expresión, estimación y/o recomendación contenida en este informe constituyen el juicio o visión de área de Research & Strategy de Insigneo Securities LLC. o sus proveedores, a la fecha de su publicación y pueden ser modificadas sin previo aviso.
DM Wealth Management Group is the “doing business as entity” through which Cristina Mendez, Zoraida Diaz, and Debra Tyler, investment professionals (“IP”) of Insigneo Securities, LLC (“ISEC”) and Insigneo Advisory Services, LLC (“IAS”) conducts securities and advisory activities DM Wealth Management Group is not itself a broker dealer or an investment advisor and is not under common ownership with ISEC or IAS. Insigneo Financial Group, LLC comprises a number of operating businesses engaged in the offering of brokerage and advisory products and services in various jurisdictions. Brokerage products and services are offered through Insigneo Securities, LLC, a broker-dealer registered with the U.S. Securities and Exchange Commission (“SEC”) and member of FINRA and SIPC. Investment advisory products and services are offered through Insigneo Advisory Services, LLC, an investment adviser registered with the SEC. Insigneo has affiliated companies in different locations, so it is important to understand which entity you are conducting business with. Please visit "https://insigneo.com/legalentities" for more information about the differences between these companies, their locations, and what that means for you.
Investing involves risk, including possible loss of principal. Past performance is not indicative of future results. Please consult your Investment Professional for any recommendation regarding your specific financial situation.
Click on the following links to view ISEC Reg BI Client Relationship Summary (“Form CRS”) and IAS Form ADV Part 3 CRS.
The following content is provided by Insigneo, the firm through which DM Wealth Management’s investment professionals offer brokerage and advisory services. Visit insigneo.com to learn more.