

September 25, 2026


Redrawing the Americas
Elections, Markets, and a Shifting Hemisphere
Stay invested, but demand more from earnings. We remain constructive on equities through year-end, with greater tactical restraint as higher yields, moderating earnings growth and heavy issuance constrain valuations. Favor durable profits, diversify beyond AI, add selectively on weakness and use attractively priced hedges.
Continued U.S. expansion remains our base case. We estimate real GDP growth near 2.7 to 3%, supported by resilient private demand and AI infrastructure investment. Our recession indicator signals approximately 22% probability over six months. AI spending supports near-term activity, although overbuilding, falling model prices and rising depreciation threaten investment returns longer-term.
Disinflation depends on relief from the energy shock. We expect inflation in the United States to approach 2% by late 2027, conditional on easing energy pressures. Refining constraints, wage growth and strong infra-structure demand remain upside risks. Heavy sovereign borrowing and competing financing needs could keep long-term yields elevated even as policy rates decline.
Affordability will shape the midterms; divided government will constrain their consequences. Elevated living costs and declining presidential approval have tightened the congressional contest, leaving Senate control too close to call. We examine a Democratic congressional sweep and a Democratic House with a Republican Senate. Both retain a Republican president, limiting the scope for sweeping legislative changes.
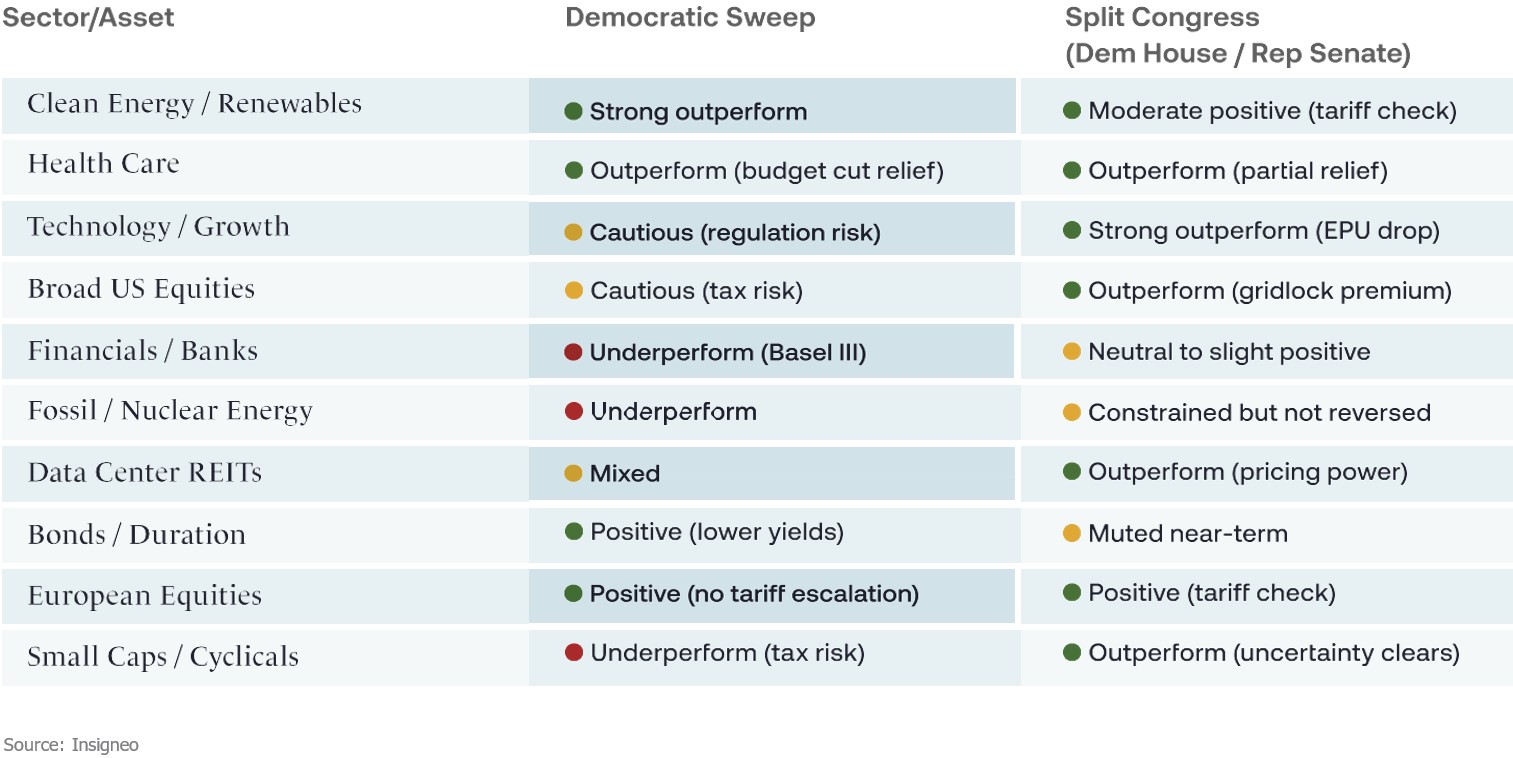
Election outcomes create conditional sector opportunities. A Democratic Congress could create relatively more favorable conditions for renewables, healthcare and longer-duration assets, while increasing policy and regulatory uncertainty for financials, technology and cyclical sectors² . A Democratic House with a Republican Senate could result in market conditions that are comparatively supportive of growth stocks, data-center REITs and small-cap equities². Aggressive rotations should await enacted policies; broader redistributive tax risks remain a consideration for the post-2028 landscape.
Latin America’s political realignment carries investment implications. Recent conservative victories have expanded alignment with Washington, while Brazil’s presidential election places the region’s largest economy in focus. Nearshoring, security cooperation, energy and critical minerals provide important channels through which political changes could influence investment.
Retain our year-end S&P 500 target of 7,800.¹ Further gains increasingly require earnings delivery. Favor large, profitable technology companies and quality growth, balanced with dividend-paying and lower-volatility stocks. Strong balance sheets and selective utilities exposure can help manage financing and valuation risks.
Favor U.S. and Asian equities, with Europe neutral. Japan offers selective opportunities in technology, industrials and financials; China and India warrant differentiated allocations. European industrials and materials merit attention. Geographic diversification requires care because technology holdings across countries can share the same AI exposure.
Bonds offer increasingly credible competition for capital. Maintain neutral overall exposure, with a role for high-quality nominal bonds and TIPS. Longer duration is becoming more attractive. Although we remain less hawkish than current market pricing, We revise our year-end U.S. 10-year Treasury yield target from 4.4% to 4.8%.¹
Be selective in credit and deliberate about currencies. Prefer equities over credit over twelve months, dollar over euro credit, and agency mortgage-backed securities over investment-grade corporates. Maintain neutral emerging-market hard-currency debt exposure, with targeted local bond and currency opportunities. Expect a modestly firmer dollar.
Keep gold as a strategic portfolio diversifier. Our year-end gold target remains $4,800 per ounce.¹ supported by official-sector demand, reserve diversification and geopolitical uncertainty. Gold complements bonds, although changing correlations, volatility and its lack of income warrant disciplined sizing.

Investors have had ample reason to lose their bearings so far this year due to the interminable conflict in the Strait of Hormuz, alternating bouts of AI hype and despair, and persistent political uncertainty. As we publish our final quarterly of the year, we take measured satisfaction in having helped them stay the course. Our principal calls have largely held up Q1 and Q3 quarterlies, and our year-end forecasts remain in play and look increasingly attainable with the exception of our 10-year Treasury fore-cast; the bond market retains its talent for keeping fore-casters humble.
However, that record earns us no exemption from vigilance. Earnings remain robust in the United States and have strengthened in Europe. We estimate U.S. economic growth at around 2.7%, above trend, and interpret recent productivity data, alongside research on AI at work, as early signs of AI-related efficiency gains. Yet higher yields and heavy IPO and debt issuance could pressure valuations through higher discount rates and greater competition for capital. EPS
growth is historically strong, but the possibility of slowing to a more sustainable pace is likely to cap multiples.
The path to our year-end equity target increasingly depends on companies delivering earnings, with less room for investors to simply pay more for them.
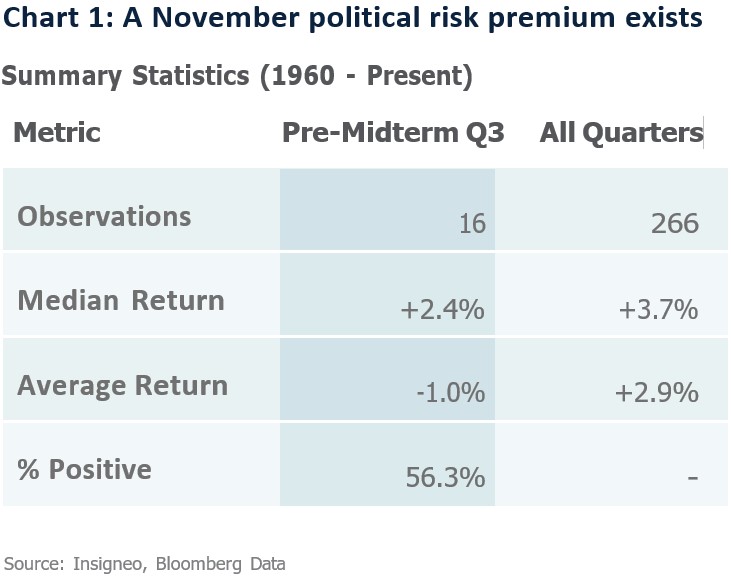
November’s midterms enter this equation through concrete channels with Congress’s roles in taxation, spending, oversight and appointments. Budget negotiations and scrutiny of industries from technology to energy can affect markets even without sweeping legislation. Our November risk-premium (Chart 1) captures the historical unease: pre-midterm third quarters aver-aged −1.0% for the S&P 500, versus +2.9% across all quarters. Still, an election can dominate the headlines without rewriting the investment case. The positive 2.4% median and modest sample of 16 observations also counsel against turning that pattern into a trading rule.
 For all the campaign drama, however, the Oval Office is not up for renewal. The presidency is absent from November’s ballot, and the presidential veto remains part of the legislative equation. Divided governments can constrain major policy changes while complicating routine funding decisions. Markets will still have earnings to discount and interest rates to digest when campaign season gives way to governing.
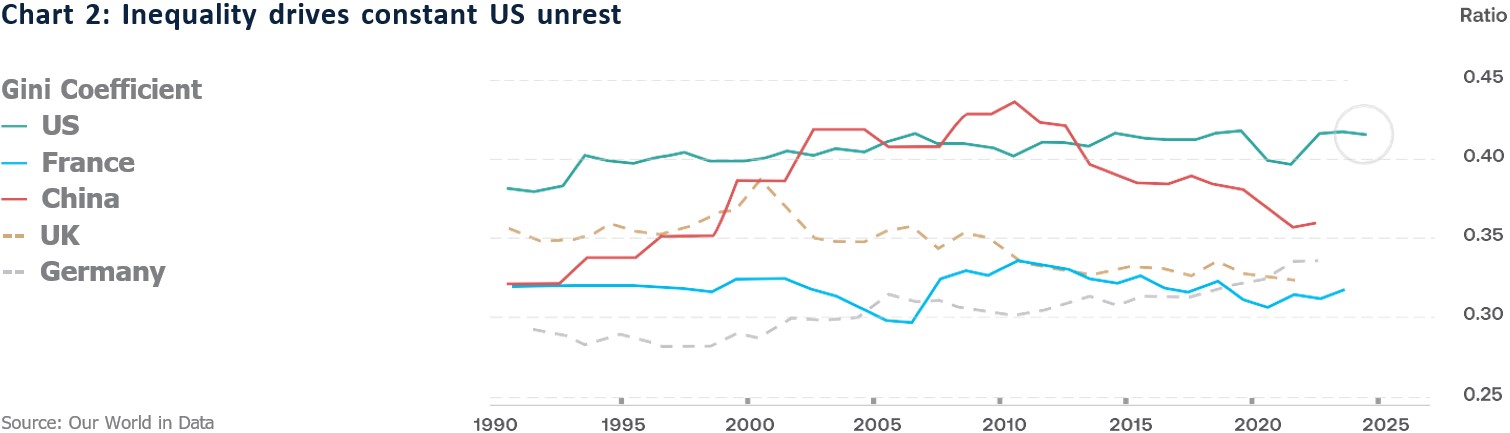
The longer-horizon question concerns when the next administration chosen in the 2028 presidential election takes office alongside a newly elected Congress. Our Gini chart (chart 2) shows U.S. income inequality elevated relative to several advanced-economy peers. Recent polling reveals broad public support for higher taxes on corporations and affluent households. These observations warrant examining more redistributive economic policies as an investment scenario. Higher taxes on profits or capital income could change after-tax returns even if the underlying businesses continue to prosper. But that tale will be told two years from now.
Across Latin America, meanwhile, recent conservative victories, including in Chile, Colombia and Peru, have expanded the group of governments more closely aligned with the Trump administration. Brazil’s October presidential election brings the presidency itself into contention, placing the region’s largest economy at the center of this quarterly’s analysis. Our regional discussion traces the potential investment implications through nearshoring, defense and security cooperation, and the energy and critical minerals supporting AI infrastructure.
Ballots allocate political power; markets must assign a value to what follows. This quarterly examines that connection across the Americas, tracing how changes in government could reach fiscal policy, corporate
earnings and the cost of capital. We begin in Washington, with the congressional races as they stand today and the economic stakes behind November’s vote.
 U.S. Midterms: Affordability and the Balance of Power
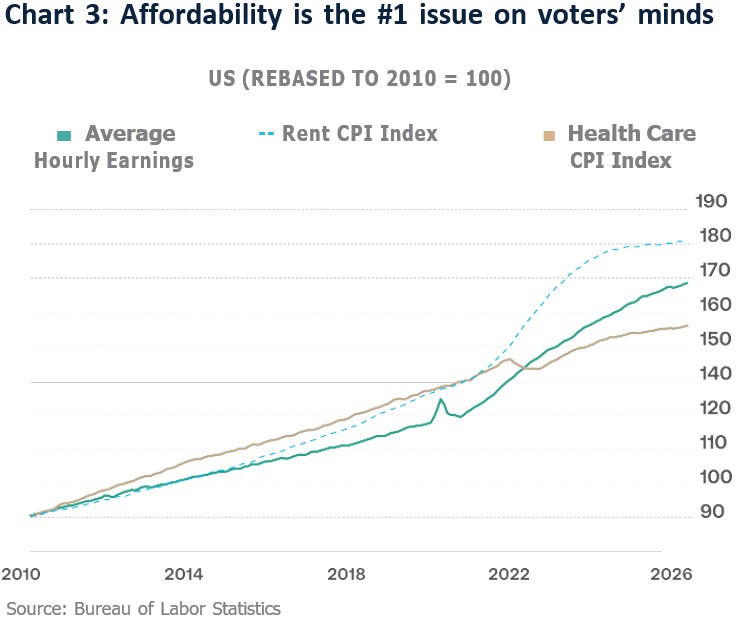
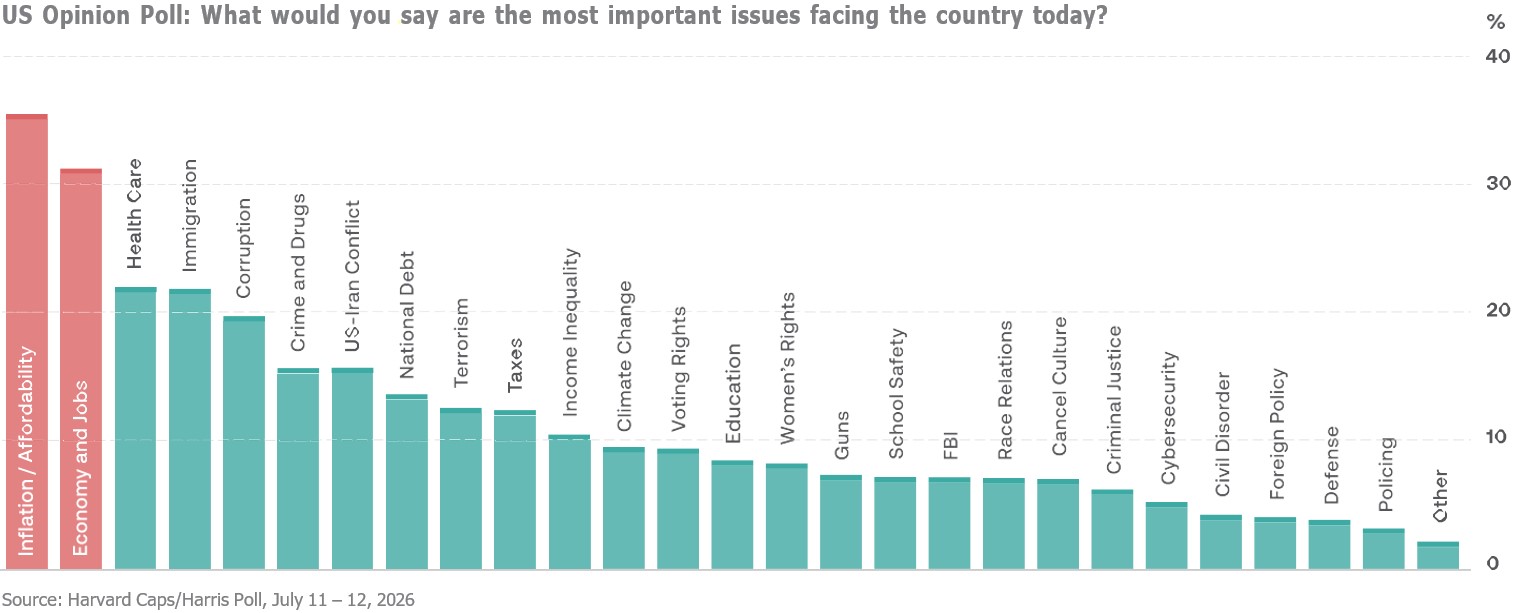
A resilient economy can still be an expensive one. Chart 3, comparing wages, rents and medical-care prices, captures that distinction as rents have outpaced average hourly earnings since 2010, although medical-care prices have risen more slowly than earnings. Chart 4 connects those household pressures to the campaign. In the July Harvard CAPS/Harris poll, inflation and afford-ability headed respondents’ concerns, followed by economy and jobs. Slower inflation, after all, does not come with a refund.
Two signature policy choices of the Trump administration have added pressure to this longstanding afford-ability problem. The war with Iran has disrupted Middle Eastern oil production and shipping, increasing energy costs. At the retail pump level, AAA data shows regular gasoline at $4.329/gallon as of September 15, up from levels around $3.00–$3.10/gallon before the war – consistent with the war-driven energy shock. A WSJ analysis estimated that U.S. consumers have collectively spent approximately $107 billion more on gasoline and the diesel during the Iran conflict than they would have absent the war, averaging more than $500 per house-hold. Moreover, the energy surge has been broad-based:
U.S. diesel prices crossed $6/gallon for the first time ever in early September, and the PPI for August showed energy as the primary driver of a 0.4% monthly gain, the largest since May. Tariffs have also raised consumer-goods prices. Extensive New York Fed research identifies effects on imported products and domestically
produced goods through more expensive inputs and reduced price competition. These are distinct channels through which foreign and trade policies reach house-hold budgets.
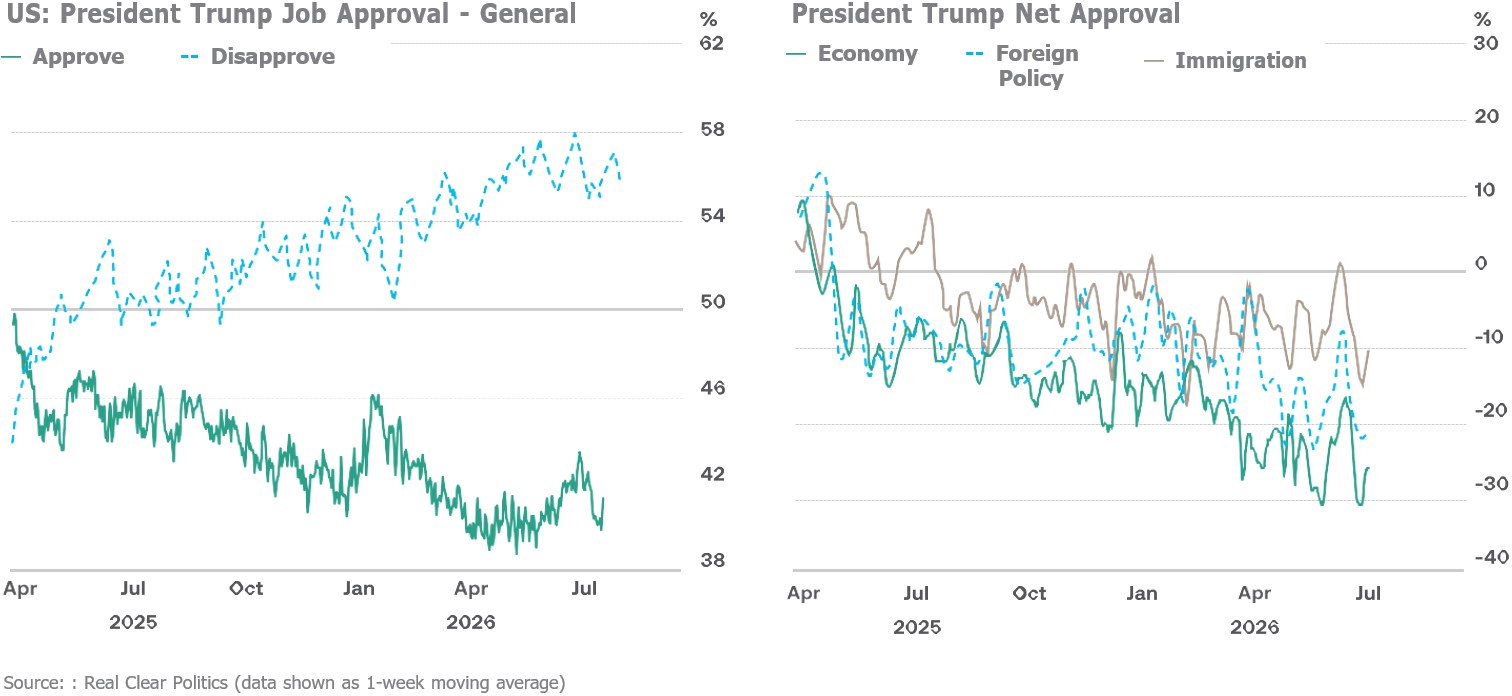
America’s declining energy intensity helps cushion the economy against higher fuel prices, but the president and his party still face an electorate preoccupied with the cost of living. Chart 5 shows the accompanying polling trend: declining presidential approval, rising disapproval, as well as negative net approval on the economy, foreign policy and immigration. In fairness, these surveys document dissatisfaction without establishing that any single policy explains it. Nor does a national approval measure translate mechanically into congressional seats. But the Senate math is looking increasingly bleak for Republicans with tighter-than-expected races in places like Maine, Michigan, Ohio and Alaska. Republicans currently hold 53 seats; the Democratic caucus, including two independents, holds 47. A net gain of four seats would give that caucus a majority without relying on the Republican vice president’s tie-breaking vote.
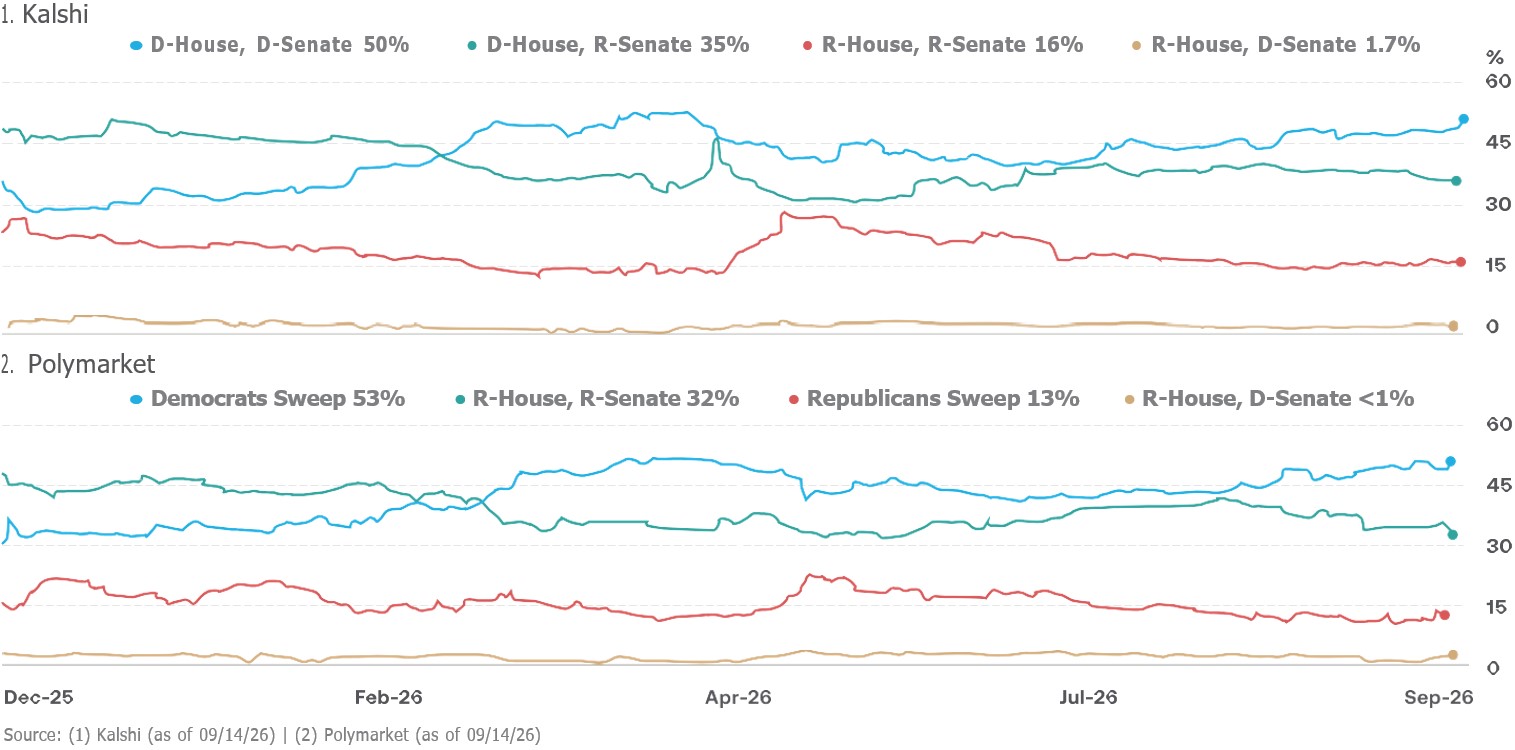
Prediction markets have taken notice. Election-implied probabilities derived from prediction markets indicate a substantial repricing of expectations⁴, as seen on chart 6. The earlier premium attached to Republican Senate-control outcomes has narrowed toward parity. In our view, the Senate contest is now “too close to call,” a material change versus the outlook a few months ago. Against that backdrop, we examine two configurations: a Democratic congressional sweep and a Democratic House with a Republican Senate.
Under a Democratic congressional sweep, both chambers’ legislative agendas and committee leadership would change hands. Democrats would set congressional oversight priorities and control the Senate’s consideration of executive and judicial nominees. The presidency, however, would remain Republican. Overriding a presidential veto requires two-thirds support in each chamber, so congressional majorities alone would not deliver higher corporate taxes or reverse existing statutes.
Under a Democratic House and Republican Senate, Democrats would control the House’s agenda and over-sight committees, while Republicans would retain Senate leadership and its role in confirmations. Legislation would still require passage through both chambers and the presidential approval or veto process. The partisan divide would run through Congress itself as well as between the House and the White House.
Whatever its ultimate composition, the next Congress will inherit an economy with its own momentum and constraints. To assess what either electoral outcome means for investors, we turn next to the U.S. and global macroeconomic landscape to assess the durability of growth, the course of inflation and the path of interest rates. These forces will help define both Washington’s room for maneuvering and the outlook for corporate earnings and asset prices.
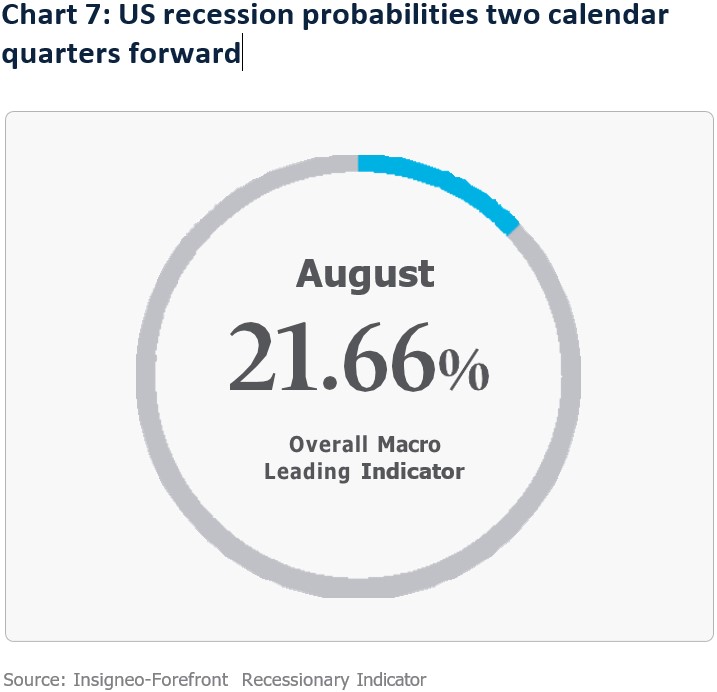
The U.S. expansion remains our base case. Our proprietary Insigneo Forefront Recessionary Indicator (Chart 7) shows a September reading of roughly 22% over a six-month horizon. In other words, there is a relatively low recession probability, but hardly permission for complacency. Our U.S. real GDP growth estimate remains around 2.7 to 3%, above trend. Although some of the recent official data point to slower growth than our projections, private domestic demand advanced 4.2%, suggesting more underlying momentum than the official data alone convey.
AI supports that momentum through investment in data centers, semiconductors, and power infrastructure. Productivity’s 2.2% year-on-year increase in the second quarter is encouraging, although aggregate statistics alone cannot isolate AI’s contribution. We expect the AI
investment cycle to continue, but falling model prices and rising depreciation could undermine returns. Nevertheless, most current AI demand indicators remain firm. In sum, investment can support the coming quarters even as overbuilding becomes a greater risk over the medium-term. It is worth remembering that a useful technology need not make every investment in it profitable.
Outside of the U.S., we find manufacturing and trade resilient beyond the Gulf states, that have been severely impacted by the ongoing conflict in Hormuz. Specifically, the AI buildout has been supporting Asian exporters. On the other hand, Europe’s recovery remains modest with the ECB projecting only modest growth of 0.9% this year and 1.4% in 2027, supported by public investment and recovering real incomes. The Bank of Japan expects moderate expansion and a gradual acceleration from fiscal 2027, as improving incomes and AI-related demand help offset expensive imported energy.
China presents a less balanced picture. Industrial strength coexists with weak consumption and property investment; August retail sales rose just 0.4% from a year earlier. There is a possibility that additional fiscal support may be an upside catalyst, but we would treat that as a scenario whose impact depends on the scale and composition of support, with sustained household demand still essential to a broader recovery.
Inflation remains the critical qualification. August U.S. headline CPI inflation was 3.4%, versus 2.4% excluding food and energy. However, we expect inflation in the United States, euro area and Britain to approach 2% by late 2027, conditional on relief from the energy shock. We believe investors should pay closer attention to the moderate growth in M2, which suggests that year-over-year inflation will ease toward its target once the initial effects of the oil-price shock roll out of the comparison base. Of course, we are vigilant about renewed wage pressures, upside risks from constrained refining capacity, low European gas inventories, fertilizer costs, and strong investment demand that lean against our base case of a disinflation path. Finally, though AI may eventually lower production costs, building its infrastructure consumes scarce resources today.
The more pronounced threat to markets could therefore arrive through financing costs. Across developed sovereign markets, heavy borrowing and reduced central-bank holdings are increasing the debt private investors must absorb. The OECD projects roughly $14 trillion in
sovereign refinancing requirements this year alone, while AI investment adds competing demand for capital. These pressures can sustain elevated long-term yields even when policy rates decline. There is a risk that persistent inflation and dependence on foreign financing could turn rising Treasury yields into a broader market correction. However, shorter-maturity yields remain less extreme than long-bond yields, helping to explain why activity has held up despite the move in rates.
In conclusion, our central case remains continued, uneven but robust expansion, with meaningful risks around energy, borrowing costs and AI investment. For investors, the next question is how much of that resilience is already reflected in prices. We turn now to our forecasts and recommendations across asset classes, assessing where prospective returns justify committing capital – and where expectations leave too little room for disappointment.
A resilient economy gives investors reason to remain invested, but higher financing costs give them reason to be scrupulous. Our stance is constructive on equities over the remainder of the year, with greater tactical restraint through the closing months of 2026. We favor durable earnings, diversification beyond AI, and meaningful exposure to income and real assets.
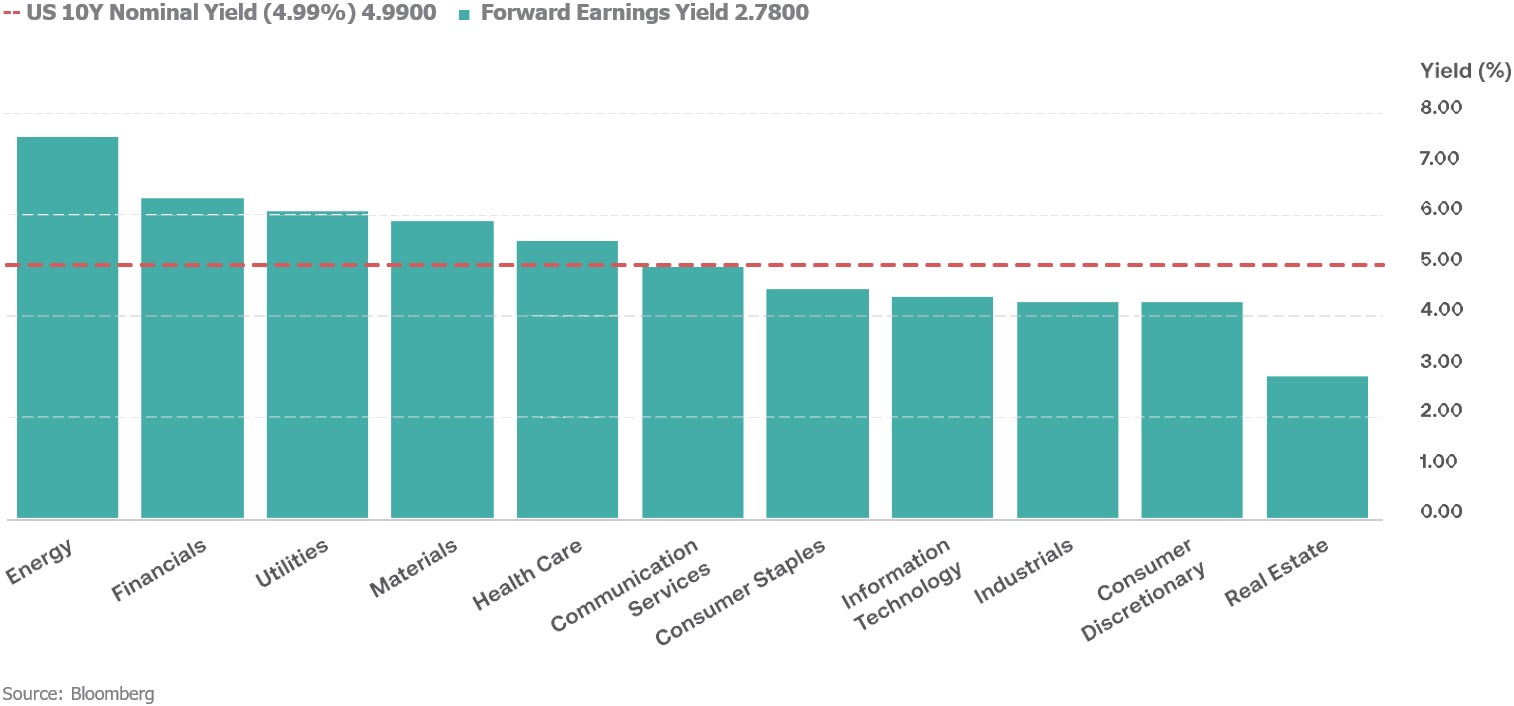
Chart 8, “Real yields – the structural shift,” captures the competition for capital. The plotted ten-year TIPS yield is approximately 2.47%, while the earnings-yield-minus-real-yield spread has narrowed to roughly 2.73 percentage points. With the S&P 500’s forward earnings yield near 5.24%, it is only 25 basis points above the 4.99% nominal Treasury yield as of September 15. In other words, bonds have become credible competitors again.
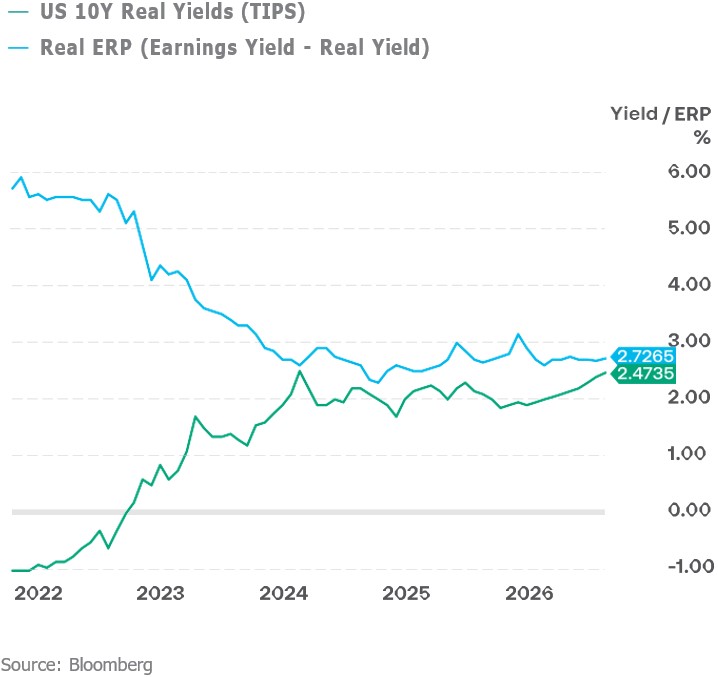 These comparisons measure valuation rather than equivalent streams of income. Of course, corporate earnings can grow, disappoint or remain inside the business. But the point is that equities increasingly need profit growth to justify their price. This is why our working year-end S&P 500 target remains 7,800 ¹, as it has been all year, despite its proximity to current level of the index. Higher yields, moderating earnings growth and heavy IPO issuance leave less room for expanding multiples to do the work.
The chart comparing S&P 500 sector forward earnings yields vs. the U.S. 10-year nominal yield (Chart 9) makes that challenge concrete. Only five sectors exceed the Treasury benchmark: Energy at 7.55%, Financials at 6.31%, Utilities at 6.00%, Materials at 5.76% and Healthcare at 5.37%. Healthcare’s cushion is thin; energy’s larger spread comes with commodity cyclicality, and a high earnings yield invites closer examination of the risks embedded in the earnings estimate.
Consequently, our preference remains large, profitable technology companies and quality growth, balanced with dividend-paying and lower-volatility stocks. We look for companies that have strong balance sheets, insulated from the transmission of rising refinancing costs, and those with realized earnings over leveraged businesses vulnerable to new IPO supply. Selective utilities exposure can complement that positioning, although interest-rate sensitivity matters. Real Estate’s 2.78% earnings yield also merits some trepidation. For REITs, cash-flow measures are needed to complete the valuation picture.
We favor U.S. and Asian equities, while maintaining a neutral European allocation that balances diversification benefits against energy costs and political uncertainty. Japan offers selective opportunities in technology, industrials and financials; China and India belong within a differentiated Asian allocation. European industrials and materials warrant attention within an otherwise measured regional stance.
However, geography alone will not diversify an AI-heavy portfolio as Korean, Taiwanese and American technology holdings can share the same economic exposure. This is why we are recommending combining global AI beneficiaries with dividend and lower-volatility stocks. Remember, different stock exchanges do not necessarily mean different risks.
Although we remain less hawkish than current market pricing, we upwardly revise our year-end U.S. 10-year bond target from 4.4% to 4.8% ¹. To be clear, that would
be lower than the current level of 4.99% on September 15, but it sheds some light on why we are starting to find long duration attractive again at current levels. We see a role for high-quality nominal bonds and TIPS, while keeping overall bond exposure neutral and avoiding an outsized bet on falling yields as fiscal borrowing and AI financing needs can sustain pressure on duration.
Credit requires selectivity. We prefer equities over credit over twelve months, favor dollar over euro credit and see value in agency mortgage-backed securities relative to investment-grade corporates. Tight spreads and heavy issuance limit compensation for additional credit risk. Emerging-market hard-currency debt merits a neutral stance. And we favor a modestly firmer dollar, making currency management consequential for inter-national returns.
In the spirit of this quarterly, we would be remiss if we did not provide a cross sector and asset view of the two most probable election scenarios we discussed previously. Chart 10 organizes and summarizes potential sector sensitivities around those congressional configurations. In the “Democratic Sweep” scenario, we favor renewables and healthcare, while flagging tax and regulatory risks for financials, technology and cyclicals². In the “Democratic House/Republican Senate” iteration, we would be more constructive on growth stocks, data-center REITs and small caps². European equities would benefit under both configurations, as it would likely lead to reduced tariff-related pressure. Notably, we envisage stronger duration returns under a fully Democratic Congress as it would further remove additional fiscal transfers from the realm of the plausible.
These are conditional scenarios. Both leave the presidency unchanged, and legislation remains subject to presidential approval or a veto override. Congressional control alone would therefore not deliver higher corporate taxes or renewed subsidies. Nor does it automatically extinguish delegated executive tariff powers. Those are positive outcomes, in our view. On the other hand, there is now bipartisan scrutiny of AI infrastructure, although we similarly believe those will be off the table until 2029 at the earliest. In the end, we would look for enacted budgets and concrete regulatory decisions before making aggressive sector rotations. It is worth remembering that a change in committee chairs is not yet a change in cash flows.
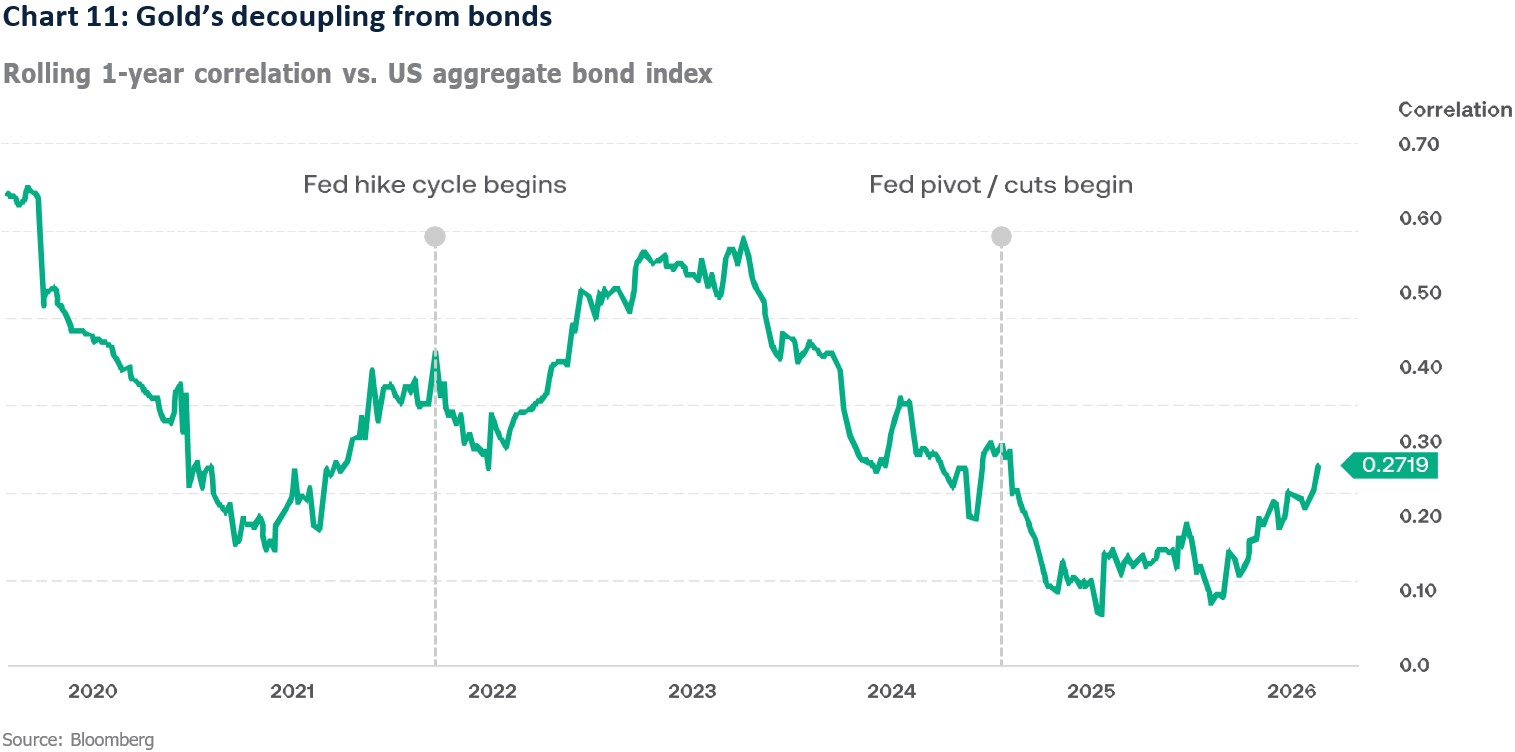
For some time now, gold has been decoupling from bonds and becoming, once again, a portfolio diversifier. Chart 11 shows the rolling one-year correlation with the U.S. aggregate bond index near +0.27, versus roughly +0.66 in early 2020. Correlation has recently rebounded from lower levels, so the evidence supports diversification without promising permanent independence.
We continue to view gold as a potential portfolio diversifier alongside traditional fixed income allocations⁵, supported by official-sector demand, reserve diversification, and geopolitical uncertainty. Our year-end fore-cast remains $4,800¹ per ounce for the precious metal,
² Election-related observations reflect hypothetical market scenarios and should not be interpreted as predictions of election results, legislative outcomes or future investment performance. See Important Disclosures.
supporting a constructive view, while gold’s lack of income and potential volatility argue for disciplined sizing.
In sum, we intend to stay invested, add selectively on weakness, and use hedges where protection is attractively priced.
The next phase of this market can reward confidence in earnings, but it will demand equal discipline about the price paid for them.
¹ See “Forward-Looking Statements and Forecasts” in the Important Disclosures section.
² Election-related observations reflect hypothetical market scenarios and should not be interpreted as predictions of election results, legislative outcomes or future in-vestment performance. See Important Disclosures.
⁴ Prediction market data reflects market-implied expectations at a specific point in time and should not be viewed as forecasts or assurances of future outcomes.
⁵ Investments in gold and other commodities involve market risk, including price volatility, fluctuations in demand, geopolitical developments and other factors that may affect performance.



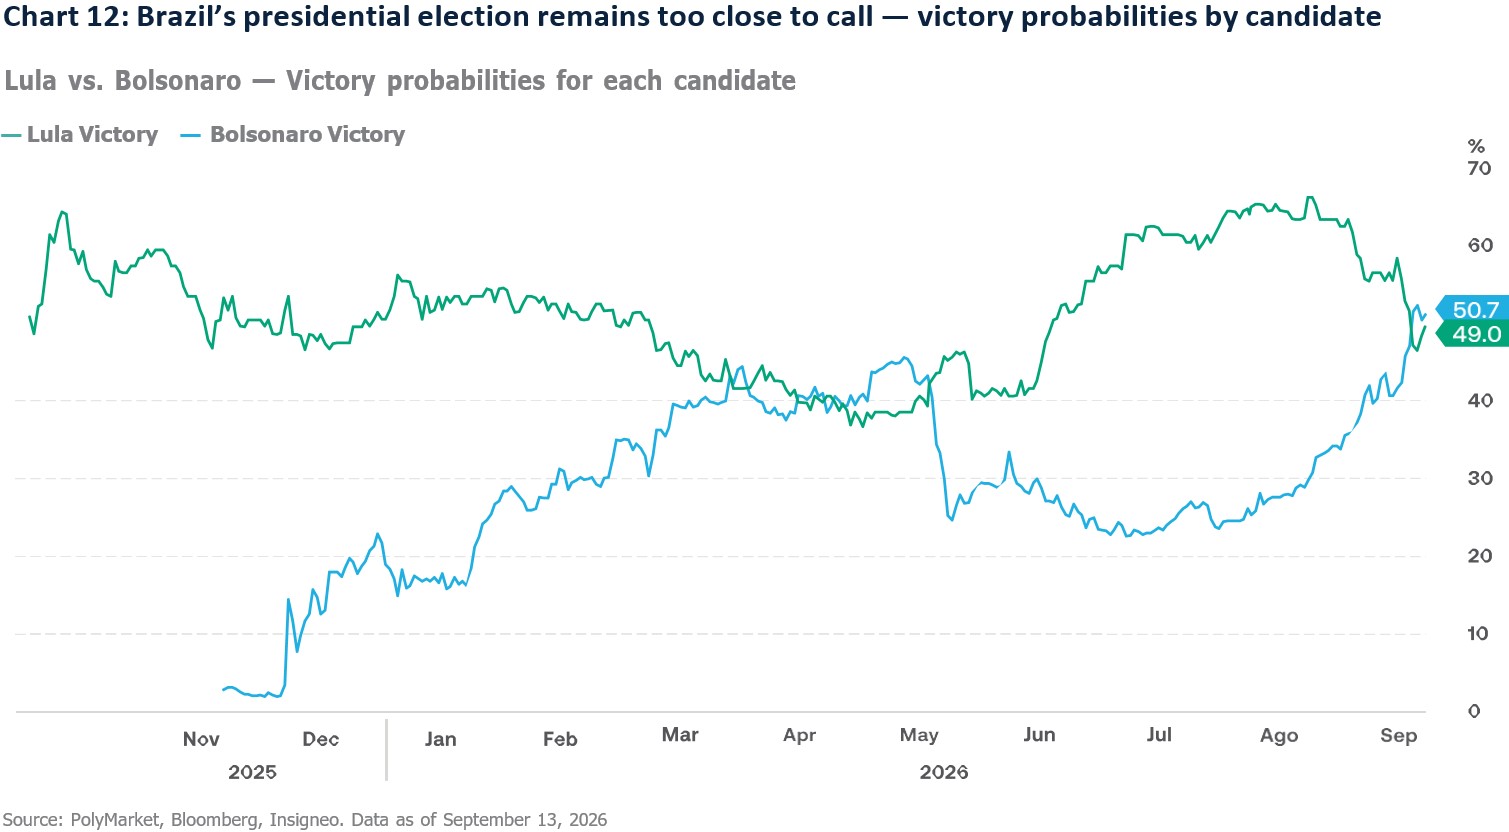
Brazil’s presidential race remains essentially a 50/50 contest, but the policy differences between Lula and Bolsonaro could have meaningful implications for fiscal policy, interest rates, sector performance, foreign investment flows, and ultimately the direction of Brazilian assets over the next four years.
The central question for investors is whether Brazil can achieve a credible fiscal adjustment as growth slows, inflation remains above target, and public finances come under increasing scrutiny.
A Lula victory would likely imply policy continuity, including support for consumers, broader access to credit, and stronger engagement with partners such as Mercosur and BRICS, though markets remain skeptical about the fiscal outlook.
A Bolsonaro victory would likely bring a stronger emphasis on fiscal consolidation, privatizations, deregulation, and private-sector investment, while maintaining pragmatic ties with both China and the United States.
The election outcome could shape very different sector winners, with Bolsonaro generally favoring financials, infrastructure, utilities, and oil & gas, while Lula could be more supportive of housing, renewable energy, health-care, and state-linked companies.
Beyond Brazil, the election could influence Latin America’s geopolitical and economic positioning, shaping the region’s integration with Western supply chains and its relationship with China in an increasingly multipolar world.
Brazil’s general election is the final major electoral contest in Latin America in 2026. In a polarized political environment shaped by scandals and controversy, the outcome could have meaningful market implications. In this section, we wanted to assess what investors might expect under a victory by either of the two leading candidates.
The election is unfolding against a challenging macro-economic backdrop. Brazil’s economic activity index, a proxy for GDP, fell 0.64% MoM in June, amid signs of cooling demand after a prolonged period of extremely tight monetary policy. As a result, market participants have trimmed their 2027 GDP growth estimates to 1.45%, according to the latest Focus survey published by the Central Bank, while 2026 GDP expectations remain around 1.89%.
The slowdown in economic activity does not automatically give Brazil’s Monetary Policy Committee (COPOM) room to accelerate monetary easing. Inflation remains above target, even though the July and August readings declined on an annual basis. That decline was partly driven by temporary factors, including a one-time credit that reduced electricity bills and a third consecutive monthly fall in food prices. Market analysts expect inflation to reverse part of that decline in upcoming readings, supported by higher oil prices and the possible materialization of El Niño risks.
Against this backdrop, COPOM began a cautious easing cycle in March, cutting rates by 25bps per meeting and accumulating 125bps of cuts from the rate peak of 15% by September 16. Although August’s decision to cut was unanimous, supported by moderating economic activity and slowing inflation, COPOM remains focused on inflation expectations that are still above target for both 2026 and 2027, as well as on the transmission of fiscal policy into monetary policy and financial assets. That fiscal link is central: a looser fiscal stance weakens COPOM’s ability to control inflation and requires higher interest rates to achieve disinflation.
Brazil’s total budget deficit is expected to widen to 8.9% in 2026, reflecting high public-debt levels and looser fiscal measures implemented by Lula’s administration. Measures such as higher minimum wages, a higher income-tax exemption threshold, fuel subsidies, and debt-relief programs continue to support growth, but they also make fiscal compliance more difficult. The spending outlook is rigid as well: compulsory spending exceeds 91% of total spending and includes outlays that are mandatory, indexed, linked to social security or benefits, or constitutionally protected. As a result, the government has limited control over expenditures, making the Lula administration’s ambitious fiscal targets difficult to achieve on their own. For investors to believe in a durable fiscal adjustment, reforms will need to address this expenditure rigidity.
With the macroeconomic backdrop in view, the next question is how the policy mix could evolve under either a Lula or Bolsonaro administration over the next four years. At the time of writing, the presidential race remains too close to call, with Polymarket assigning a 49% probability to a Lula victory and a 50.7% probability to a Bolsonaro victory (see graph 12).
Under a Lula victory, markets would likely expect continuity with the current fiscal policy mix: support for the Brazilian consumer, renewed stimulus, broader access to credit, and, ultimately, higher household indebted-ness. The key question is whether that support can coexist with credible fiscal consolidation.
Lula’s latest budget proposal targets a primary surplus of 0.5% of GDP, but markets received it with skepticism. The main concern is that the effective surplus is expected to reach BRL 18.6 billion, well below the BRL 83.4 billion headline figure, because some spending is excluded from the fiscal target.
That skepticism also reflects the interaction between fiscal policy, credit growth, and monetary policy. Central Bank President Gabriel Galípolo has flagged expanded access to financing under the Lula administration as a concern, since above-potential economic activity can undercut tight monetary policy. He also noted that inclusion programs that expanded credit card use have contributed to more revolving credit and monthly installments at higher interest rates.
To ease market concerns about the country’s fiscal outlook, Brazil’s Finance Minister Dario Durigan has signaled a commitment to gradually strengthening public finances; however, some members of the Lula administration, like his policy platform chief José Sérgio Gabrielli, have shunned austerity measures while opposing proposals to end real minimum wage increases or to weaken mandatory spending rules. Going forward, market participants believe that fiscal measures adopted in 2025 and 2026 provide near-term support for economic activity, but they create a high comparison base for 2027, when the most probable scenario is reduced stimulus.
On international trade, a Lula victory could point to broader engagement with regional and multilateral partners, especially Mercosur and BRICS. That orientation could open new export markets and help offset trade tensions between Brazil and the United States.
While Bolsonaro’s economic plan remains anchored in fiscal discipline, a smaller state, and greater private-sector participation, it also seeks to preserve key social programs, reflecting a more pragmatic approach aimed at broadening its appeal beyond the traditional conservative electorate.
Fiscal consolidation is at the core of Bolsonaro’s agenda. The plan centers on stabilizing and gradually reducing public debt through sustained primary surpluses, tighter spending controls, and a more efficient public sector. Administrative reforms would include eliminating at least ten ministries, reducing commissioned positions, and streamlining the federal bureaucracy, all with the objective of improving the sustainability of public finances. The broader economic vision would involve reducing the state’s direct role in the economy and creating greater space for private investment. A renewed National Privatization Program, alongside expanded concessions and public-private partnerships, would likely be a central pillar of the strategy. Infrastructure, transportation, logistics, and utilities could be among the main beneficiaries, as private capital assumes a larger role in financing investment, improving productivity, and supporting long-term growth.
The same market-oriented philosophy extends to tax, regulatory, and trade policy. The agenda proposes revisiting aspects of the recently approved consumption-tax framework with the goal of lowering the effective tax burden through expenditure restraint rather than higher government revenues. It also emphasizes reducing tax distortions, simplifying regulation, strengthening legal certainty, and improving the overall business environment. On the external trade policy front, Bolsonaro supports OECD accession, broader trade agreements, deeper integration into global value chains, and the gradual elimination of the IOF tax on foreign-exchange transactions, all aimed at increasing Brazil’s attractive-ness to foreign investors.
On foreign policy, the approach would likely remain pragmatic rather than ideological, seeking to preserve strong commercial relations with both the United States and China. This reflects the recognition that China remains Brazil’s largest trading partner while the United States continues to be a key source of investment, technology, and financial flows. Rather than significantly altering Brazil’s geopolitical posture, the emphasis would likely be on expanding economic ties with both countries while maintaining a balanced international stance.
At the same time, Bolsonaro’s agenda attempts to balance fiscal responsibility with social and strategic priorities. Major income-transfer programs would be maintained, while targeted public-bank financing would remain avail-able for selected strategic sectors. In energy, the agenda combines greater private-sector participation in oil, gas, and infrastructure with continued support for renewables, biofuels, biocontents, and investments linked to digital infrastructure such as data centers. Together, these priorities reflect an effort to foster growth while preserving long-term development goals.
Having outlined the two policy scenarios, let us review their potential implications for Brazilian assets.
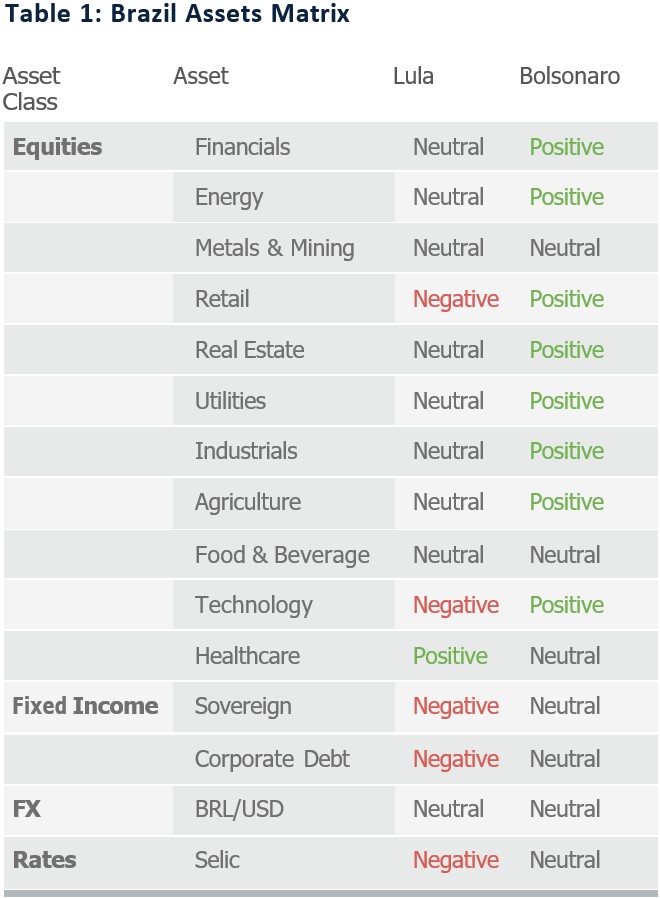
While Brazilian equities would likely exhibit high volatility in response to a victory by either Bolsonaro or Lula, different election outcomes could influence sectors and asset classes differently due to differences in economic, fiscal and regulatory policy priorities.²
A Bolsonaro presidency would likely be viewed as a pro-market, fiscally conservative, and deregulation-oriented outcome, emphasizing spending restraint, privatizations, and a reduced role for the state. In this environment, investors would likely favor sectors tied to lower risk premiums, increased private-sector investment, and potentially lower interest rates. Financials could be among the sectors that may benefit under this scenario², as banks, asset managers, and capital-markets businesses could benefit from stronger credit growth and improved investor confidence. Infrastructure concessionaires, utilities and oil & gas companies could experience relative tailwinds under this policy framework², on expectations of privatizations, market-based regulation, and reduced state intervention. Agribusiness would remain a key beneficiary given the Bolsonaro movement’s close alignment with the farming sector, while domestic cyclicals, retailers, and small caps could gain from stronger business confi-dence and economic growth expectations.
By contrast, a Lula administration is generally associated with a more active state role, including public investment, industrial policy, social spending, and support for strategic national champions. As a result, the “Lula trade” tends to favor infrastructure, construction, and affordable housing, sectors that benefit directly from government investment programs and support from institutions such as BNDES, while state-linked companies may also receive policy support and investment backing. In addition, Lula’s focus on decarbonization and industrial development could benefit renewable energy, biofuels, and other energy-transition themes, while income-transfer programs and minimum-wage growth tend to support consumer companies that serve lower-income households. Healthcare providers and selected industrial manufacturers could also benefit from increased public spending and strategic development initiatives.
As we can see on Table 1, the “Bolsonaro trade” is centered on financials, privatizations, infrastructure concessions, utilities, oil & gas, agribusiness, and domestic cyclicals, reflecting expectations of fiscal discipline and deregulation. Under a Lula administration scenario, investors may focus on sectors associated with public investment, infrastructure and selected industrial policy initiatives.² For investors, the key distinction is that Bolsonaro’s winners are largely driven by market liberalization and private investment, while Lula’s winners tend to benefit from government support, public spending, and strategic policy initiatives. Ultimately, Brazilian elections do not just choose a president; they determine which playbook investors are likely to reward. Whether the market favors Bolsonaro’s private-sector engine or Lula’s state-led development model, the winners may change, but volatility is likely to remain high.
For fixed income, credible fiscal consolidation would likely support Brazilian sovereign debt by lowering inflation expectations and reducing the sovereign risk premium. By contrast, continued fiscal largesse could worsen debt dynamics, unanchor inflation expectations, and keep monetary policy restrictive for longer, creating a less favorable environment for the asset class. The key caveat is that any fiscal adjustment, regardless of the incoming administration, will depend on Congressional support in a fragmented legislature that is expected to lean center-right.
On the credit front, a Lula victory without a credible fiscal adjustment could support sectors that benefit from state backing, even in an environment that would otherwise be less favorable for the asset class. A Bolsonaro victory, by contrast, would likely bring a more market-friendly and less regulated environment, supporting corporate profits and contributing positively to credit performance. However, the Brazilian corporate debt market has also seen several high-profile credit events, including Raízen, CSN, Braskem, and Aegea, that have pushed risk premiums beyond fundamentals. These developments have undermined trust in Brazilian credit and heightened volatility, especially in lower-rated names. Even so, companies with solid fundamentals, such as MercadoLibre, a regional e-commerce leader with Brazil as its largest market, have been able to access the market at attractive spreads, reinforcing the case for a market that continues to favor quality over noise.
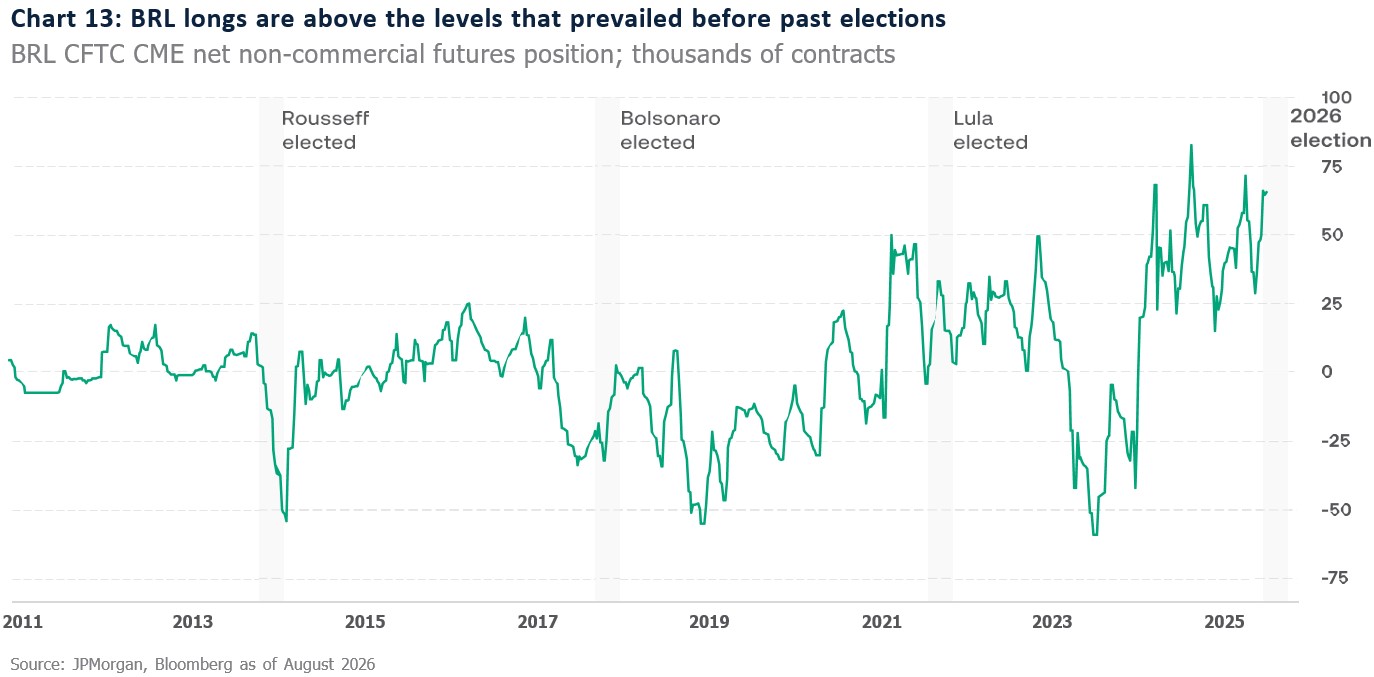
While the Brazilian real has historically been one of the currencies most exposed to presidential election cycles, the current episode has been remarkably resilient. The main reason is carry. With nominal and real interest rates still near historical highs, Brazil remains one of the most attractive yield destinations in emerging markets, allowing the currency to withstand electoral noise far better than in previous cycles.
That resilience may be creating a false sense of security. Despite the approaching election, the BRL appears to carry little meaningful election risk premium, trading close to fair value even as political uncertainty rises. At the same time, speculative long positioning is near record highs, as shown in Chart 13, with investor exposure exceeding levels observed before previous elections. This suggests that much of the market is already positioned for stability, leaving the currency vulnerable to disappointment.
More importantly, the carry story itself is tied to Brazil’s underlying fiscal challenges. Interest rates remain elevated because markets continue to demand compensation for persistent fiscal deficits and an uncertain debt trajectory. Without a credible commitment to fiscal consolidation, the central bank has limited room to deliver a sustained easing cycle, as looser monetary
policy could quickly reignite concerns around inflation and currency stability. Ultimately, the election is less about politics and more about fiscal credibility. A credible commitment to fiscal discipline would likely allow interest rates to fall over time, reducing some of the BRL’s current carry support. However, the resulting decline in fiscal risk premia and improvement in investor confidence could provide a stronger and more sustainable foundation for the currency. Conversely, if fiscal concerns persist, high rates may continue to support the BRL in the short term, but the currency would remain vulnerable to depreciation as investors demand greater compensation for rising fiscal and debt sustainability risks.
Brazil’s presidential election, while obvious in its domestic scope, also carries implications far beyond its borders. As the region’s largest economy and home to its deepest equity and fixed income markets, Brazil can influence investor sentiment, regional growth prospects, and the allocation of global capital across Latin America. The election outcome will also matter for geopolitical aalignment. A pro-Western orientation could reinforce Latin America’s role as a supplier of commodities needed for artificial intelligence, data centers, electrification, and advanced manufacturing, consolidating the region as a key link in Western supply chains. By contrast, stronger alignment with China could accelerate Beijing’s influence through trade, infrastructure investment, and resource development, creating a more fragmented regional landscape. Given Brazil’s economic scale, commodity relevance, and leadership role in South America, the election could ultimately shape whether Latin America moves toward greater hemispheric integration or evolves into two distinct geopolitical and economic blocs competing for influence in an increasingly multipolar world.
¹ See “Forward-Looking Statements and Forecasts” in the Important Disclosures section.
² Election-related observations reflect hypothetical market scenarios and should not be interpreted as predictions of election results, legislative outcomes or future investment performance. See Important Disclosures.
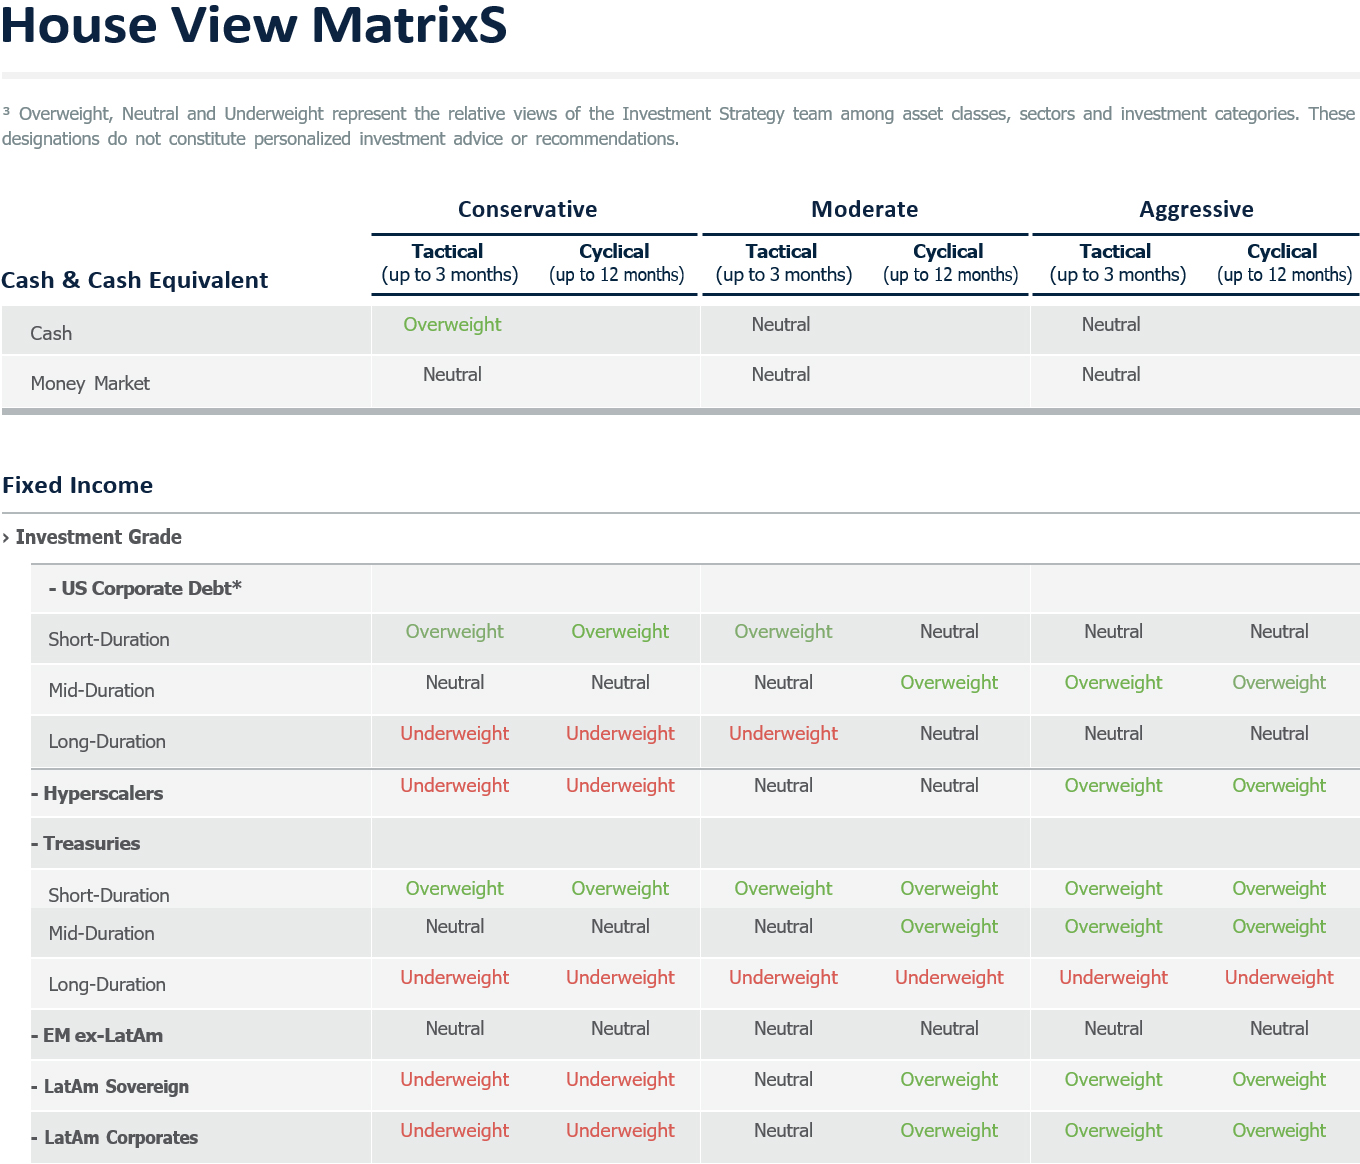
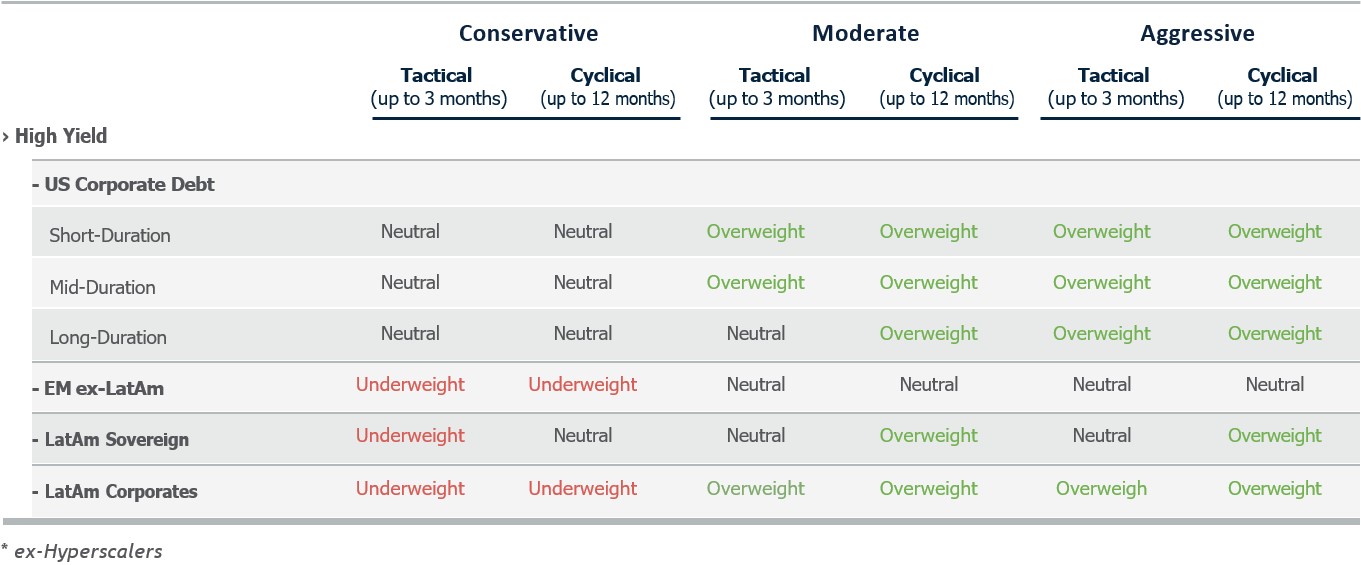
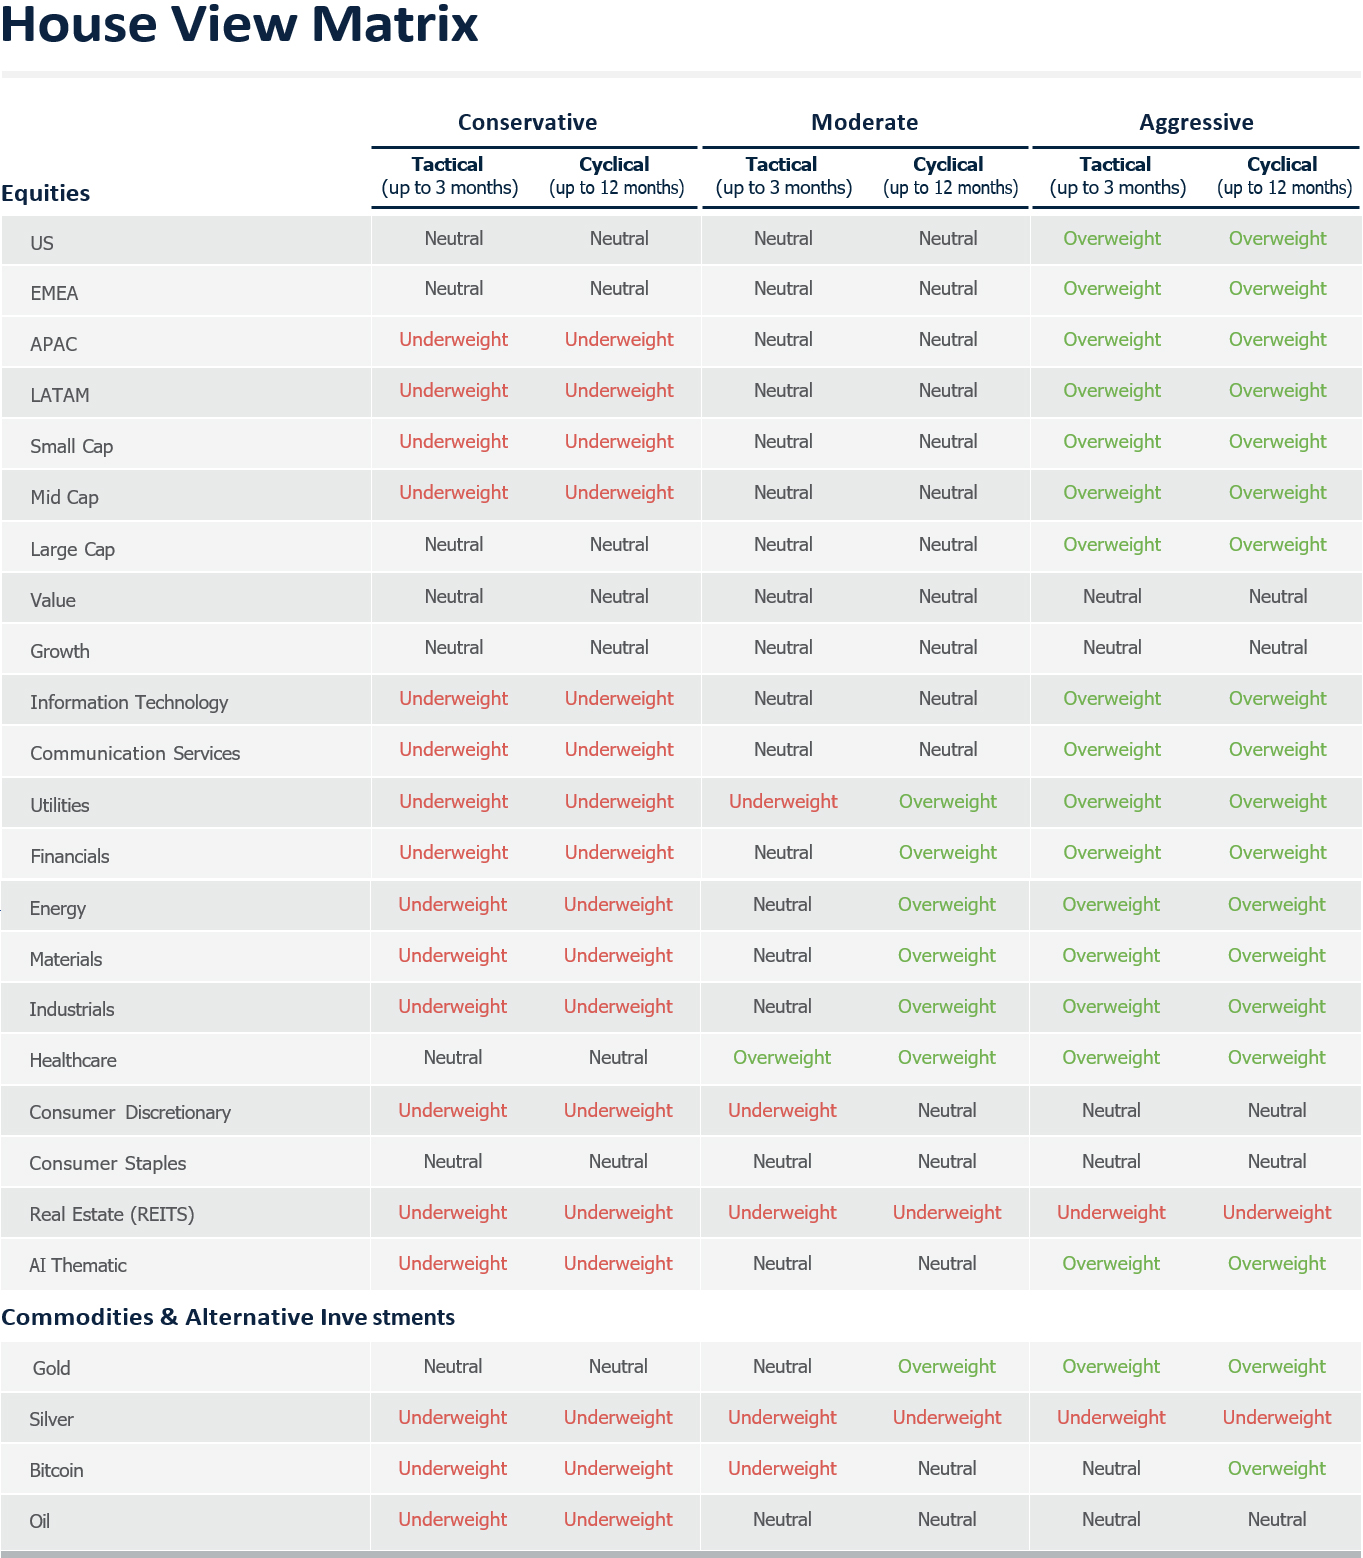
³ Overweight, Neutral and Underweight represent the relative views of the In-vestment Strategy team among asset classes, sectors and investment categories. These designations do not constitute personalized investment advice or recommendations.
⁴ Prediction market data reflects market-implied expectations at a specific point in time and should not be viewed as forecasts or assurances of future outcomes.
⁵ Investments in gold and other commodities involve market risk, including price volatility, fluctuations in demand, geopolitical developments and other factors that may affect performance.
The views, opinions, forecasts, estimates, projections, price targets and market expectations contained in this publication are those of the Investment Strategy team as of the date of publication and are subject to change without notice. Such statements are based upon current assumptions, expectations, market conditions and information believed to be reliable at the time of publication. Actual market, economic and investment outcomes may differ materially from those expressed or implied herein.
Forecasts, projections, estimates, price objectives, yield targets and expected outcomes are inherently uncertain and should not be construed as guarantees, assurances, promises or indications of future performance. There can be no assurance that any forecast, projection, estimate, target or expectation discussed in this publication will be realized.
This publication may contain forward-looking statements regarding economic conditions, financial markets, asset classes, sectors, industries, investment themes, public policy and political developments. Forward-looking statements involve known and unknown risks, uncertainties and assumptions that could cause actual results to differ materially from those anticipated.
References to potential market implications associated with elections, legislative developments, regulatory changes, fiscal policy initiatives or other political events are provided solely for informational and educational purposes. Any election-related, policy-related or geopolitical analysis presented herein constitutes hypothetical scenario analysis and should not be interpreted as a prediction of election outcomes, legislative actions, government policy decisions or future market performance.
Scenario analyses are intended to illustrate how certain economic, market or policy developments could affect various asset classes, sectors, industries or investment themes under differing assumptions. Such analyses are inherently speculative, depend upon numerous assumptions and are not intended to predict future events or investment results.
References to sectors, industries, asset classes, investment themes, commodities, currencies, regions or markets that may benefit from, be adversely affected by, or exhibit sensitivity to certain economic, political or market conditions are illustrative in nature and do not constitute recommendations to buy, sell or hold any security, investment product or investment strategy.
Any discussion of relative attractiveness among asset classes, sectors, industries or investment categories reflects the opinions of the Investment Strategy team at the time of publication. Designations such as “Overweight,” “Neutral” and “Underweight” represent relative views within the framework of the firm’s investment outlook and are not personalized investment advice, model portfolio allocations, suitability determinations or recommendations for any specific investor.
The House View Matrix and any other allocation frameworks presented in this publication are intended solely to communicate relative market perspectives and strategic outlooks. Such frameworks do not take into account an investor’s individual investment objectives, financial circumstances, risk tolerance, liquidity needs, tax considerations or other factors relevant to making investment decisions.
Any references to probability assessments, market-implied expectations or prediction market data are derived from third-party sources believed to be reliable. Such information reflects estimates and expectations at a particular point in time and should not be interpreted as forecasts, endorsements or assurances regarding future outcomes.
Investments in commodities, including gold and other precious metals, involve unique risks, including market volatility, geopolitical developments, changes in supply and demand, currency fluctuations and other factors that may significantly affect performance. Historical correlations and diversification characteristics may not persist in the future.
Asset allocation, diversification, hedging and risk-management techniques do not guarantee profits, prevent losses or ensure that investment objectives will be achieved. All investments involve risk, including the possible loss of principal.
Investors should evaluate any investment decision in light of their own objectives, financial situation and risk tolerance and should consult with their Investment Professional before implementing any investment strategy discussed in this publication.
Insigneo” and “Insigneo Wealth” are brand names used by Insigneo Financial Group, LLC and its affiliates. Brokerage products and services are offered through Insigneo Securities, LLC, a broker-dealer, registered with the U.S. Securities and Exchange Commission (“SEC”) and a member of FINRA and SIPC. Investment advisory products and services are offered through Insigneo Advisory Services, LLC, an SEC-registered investment adviser. Because we operate through various affiliates in different locations, please visit https:// insigneo.com/legalentities/ to understand which entity you are working with and what that means for you. This material should not be construed as an offer to sell or the solicitation of an offer to buy a security. It is for general information purposes only. To the extent that this material discusses general market activity, industry or sector trends or other broad-based economic or political conditions, it should not be construed as research investment advice. To the extent that it includes references to securities, those references do not constitute a recommendation to buy, sell or hold such security. It does not constitute a recommendation or a statement of opinion, or a report of either of those things and does not, and is not intended, to consider the particular investment objectives, financial conditions, or needs of the individual investors.
Not All Risks Are Disclosed – Past performance is not indicative of futures results. Investment involves significant risk, and it is possible to lose some or all of your principal investments and therefore may not be suitable for everyone. Always consider whether any investment is suitable for your particular circumstances and, if necessary, seek professional advice from your Investment Professional. This material may contain opinions, expressions an estimated that represent the analysis and perspective of Insigneo Securities, LLC’s Investment Strategy Department or its providers at the time of publication. These are subject to change at any time without notice.
FOR AFFILIATES LOCATED IN CHILE
Insigneo Asesorías Financieras SPA se encuentra inscrito en Chile, en el Registro de Prestadores de Servicios Financieros de la Comisión para el Mercado Financiero. Este informe fue efectuado por área de Research & Strategy de Insigneo Securities LLC. o sus proveedores, en base a la información disponible a la fecha de emisión de este. Para evitar cualquier conflicto de interés, Insigneo Securities LLC dispone que ningún integrante del equipo de Research & Strategy tenga su remuneración asociada directa o indirectamente con una recomendación o reporte específico o con el resultado de una cartera. Aunque los antecedentes sobre los cuales ha sido elaborado este informe fueron obtenidos de fuentes consideradas confiables, no podemos garantizar la completa exactitud e integridad de estos, no asumiendo responsabilidad alguna al respecto Insigneo Securities LLC, Insigneo Asesorías Financieras SPA ni ninguna de sus empresas relacionadas. Este material está destinado únicamente a facilitar el debate general y no pretende ser fuente de ninguna recomendación específica para una persona concreta. Por favor, consulte con su ejecutivo de cuentas o con su asesor financiero si alguna de las recomendaciones específicas que se hacen en este documento es adecuada para usted. Este documento no constituye una oferta o solicitud de compra o venta de ningún valor en ninguna jurisdicción en la que dicha oferta o solicitud no esté autorizada o a ninguna persona a la que sea ilegal hacer dicha oferta o solicitud. Las inversiones en cuentas de corretaje y de asesoramiento de inversiones están sujetas al riesgo de mercado, incluida la pérdida de capital. La información base del presente informe puede sufrir cambios, no teniendo Insigneo Securities LLC ni Insigneo Asesorías Financieras SPA la obligación de actualizar el presente informe ni de comunicar a sus destinatarios sobre la ocurrencia de tales cambios. Cualquier opinión, expresión, estimación y/o recomendación contenida en este informe constituyen el juicio o visión de área de Research & Strategy de Insigneo Securities LLC. o sus proveedores, a la fecha de su publicación y pueden ser modificadas sin previo aviso.
FOR AFFILIATES LOCATED IN URUGUAY
Insigneo Asesor Uruguay S.A. está inscripto en el Registro de Mercado de Valores del Banco Central del Uruguay como Asesor de Inversiones. En Uruguay, los valores están siendo ofrecidos en forma privada de acuerdo al artículo 2 de la ley 18.627 y sus modificaciones. Los valores no han sido ni serán registrados ante el Banco Central del Uruguay para oferta pública. Este material está destinado únicamente a facilitar el debate general y no pretende ser fuente de ningunarecomendación específica para una persona concreta. Por favor, consulte con su ejecutivo de cuentas o con su asesor financiero si alguna de las recomendaciones específicas que se hacen en este documento es adecuada para usted según su perfil y estrategia de inversión. Este documento no constituye un asesoramiento ni una recomendación u oferta o solicitud de compra o. Las inversiones en valores negociables están sujetas al riesgo de mercado, incluida la pérdida parcial o total del capital invertido. Cualquier opinión, expresión, estimación y/o recomendación contenida en este informe constituyen el juicio o visión de área de Research & Strategy de Insigneo Securities LLC. o sus proveedores, a la fecha de su publicación y pueden ser modificadas sin previo aviso. Rentabilidades históricas de los productos anunciados no aseguran rentabilidades futuras.
FOR AFFILIATES LOCATED IN ARGENTINA
Insigneo Argentina S.A.U. Agente Asesor Global de Inversión se encuentra registrado bajo el N° 1053 de la Comisión Nacional de Valores (CNV) e inscripto ante la Inspección General de Justicia (IGJ) bajo el N° 12.278 del Libro 90, Tomo –, de Sociedades por Acciones. Este informe fue efectuado por área de Research & Strategy de Insigneo Securities LLC. o sus proveedores, en base a la información disponible a la fecha de su emisión. Para evitar cualquier conflicto de interés, Insigneo Securities LLC dispone que ningún integrante del equipo de Research & Strategy tenga su remuneración asociada directa o indirectamente con una recomendación o reporte específico o con el resultado de una cartera. Aunque los antecedentes sobre los cuales ha sido elaborado este informe fueron obtenidos de fuentes consideradas confiables, no podemos garantizar la completa exactitud e integridad de estos, no asumiendo responsabilidad alguna al respecto Insigneo Securities LLC, Insigneo Argentina S.A.U. ni ninguna de sus empresas relacionadas. La información base del presente informe puede sufrir cambios, no teniendo Insigneo Argentina S.A.U. la obligación de actualizar el presente informe ni de comunicar a sus destinatarios sobre la ocurrencia de tales cambios. Este material está destinado únicamente a facilitar el debate general y no pretende ser fuente de ninguna recomendación específica para una persona concreta. Por favor, consulte con su ejecutivo de cuentas o con su asesor financiero si alguna de las recomendaciones específicas que se hacen en este documento es adecuada para usted. Este documento no constituye una oferta, recomendación o solicitud de compra o venta de ningún valor negociable en ninguna jurisdicción en la que dicha oferta o solicitud no esté autorizada o a ninguna persona a la que sea ilegal hacer dicha oferta o solicitud. Las inversiones en valores negociables están sujetas al riesgo de mercado, incluida la pérdida parcial o total del capital invertido. Cualquier opinión, expresión, estimación y/o recomendación contenida en este informe constituyen el juicio o visión de área de Research & Strategy de Insigneo Securities LLC. o sus proveedores, a la fecha de su publicación y pueden ser modificadas sin previo aviso.
FOR AFFILIATES LOCATED IN COLOMBIA – Oficina De Representación en Colombia
La Oficina de Representación fue autorizada por la Superintendencia Financiera de Colombia el 5 de febrero de 2021, para promover o publicitar en Colombia, o a sus residentes, los productos y servicios del mercado de valores ofrecidos por Insigneo Securities, LLC e Insigneo Advisory Services, LLC. La información contenida en este informe ha sido obtenida de fuentes consideradas confiables; no obstante, no se garantiza su exactitud ni integridad, no asumiendo responsabilidad alguna Insigneo Securities, LLC e Insigneo Advisory Services, LLC ni sus entidades relacionadas. Este material tiene fines exclusivamente informativos y no constituye una recomendación personalizada. Las inversiones están sujetas a riesgos de mercado, incluida la posible pérdida de capital, por lo que se recomienda consultar con su asesor financiero. La información, opiniones y estimaciones aquí contenidas corresponden a la fecha de publicación, pueden ser modificadas sin previo aviso y no existe obligación de actualización por parte de las entidades mencionadas.
DM Wealth Management Group is the “doing business as entity” through which Cristina Mendez, Zoraida Diaz, and Debra Tyler, investment professionals (“IP”) of Insigneo Securities, LLC (“ISEC”) and Insigneo Advisory Services, LLC (“IAS”) conducts securities and advisory activities DM Wealth Management Group is not itself a broker dealer or an investment advisor and is not under common ownership with ISEC or IAS. Insigneo Financial Group, LLC comprises a number of operating businesses engaged in the offering of brokerage and advisory products and services in various jurisdictions. Brokerage products and services are offered through Insigneo Securities, LLC, a broker-dealer registered with the U.S. Securities and Exchange Commission (“SEC”) and member of FINRA and SIPC. Investment advisory products and services are offered through Insigneo Advisory Services, LLC, an investment adviser registered with the SEC. Insigneo has affiliated companies in different locations, so it is important to understand which entity you are conducting business with. Please visit "https://insigneo.com/legalentities" for more information about the differences between these companies, their locations, and what that means for you.
Investing involves risk, including possible loss of principal. Past performance is not indicative of future results. Please consult your Investment Professional for any recommendation regarding your specific financial situation.
Click on the following links to view ISEC Reg BI Client Relationship Summary (“Form CRS”) and IAS Form ADV Part 3 CRS.
The following content is provided by Insigneo, the firm through which DM Wealth Management’s investment professionals offer brokerage and advisory services. Visit insigneo.com to learn more.