
March 13, 2026


Japan’s rally has been driven by political momentum and fiscal expansion under Sanae Takaichi, while South Korea’s surge has been fueled by heavily leveraged retail investors concentrating bets in major technology names such as Samsung Electronics and SK Hynix.
Both markets now face the same external vulnera- bility: heavy dependence on energy imports from the Middle East, much of which must pass through the Strait of Hormuz, making them particularly exposed to disruptions linked to tensions with Iran.
For export-driven economies like Japan and South Korea, a sustained rise in oil prices would quickly translate into higher production and transportation costs, eroding corporate margins and weighing on
sentiment across manufacturing-heavy equity
indices such as the TOPIX and the KOSPI.
While the world has been fixated on the war in Iran, two other market stories have been unfolding in parallel. Japan and South Korea, one the seasoned mentor, the other the export-driven tiger, have rallied in recent months for very different reasons. But after taking different roads higher, both markets are now running into the same macro force: Iran.
Let’s start with the accomplished mentor. For nearly seventy years, the Liberal Democratic Party (LDP) has dominated Japanese politics. Because Japan oper- ates under a parliamentary system, the party control- ling the legislature chooses the prime minister. After corruption scandals and falling approval ratings, the LDP replaced Fumio Kishida with Shigeru Ishiba in
2024, and later with Sanae Takaichi in October 2025. Just three months into office, Takaichi, who is aligned with the party’s more conservative wing, dissolved the House of Representatives of Japan and called elections. With little time to prepare, the opposition struggled to respond, and the LDP won a sweeping victory, securing roughly two-thirds of the seats, the strongest parliamentary majority in the post-World War II era.
Markets reacted swiftly. Since October 2025, Japan’s main equity benchmarks, the TOPIX and the Nikkei 225, have risen about 27% and 22%, respectively. Takaichi’s growth agenda centers on expansionary fiscal policy, with stimulus spending, tax relief for households, and targeted public investment to boost demand. It also prioritizes major investment in strategic industries such as semiconductors, artificial intelligence, and defense to strengthen Japan’s industrial base and long-term productivity. At first glance, the story looks entirely positive, but that is precisely where the story becomes more
complicated. Japanese equities have historically moved in cycles tied to distinct political eras.
Over the past five decades, the market has passed through several policy regimes, from the reformist period under Yasuhiro Nakasone in the 1980s to the better-known Abenomics launched by Shinzo Abe in 2012, and more recently the policy phase that began under Kishida and now continues under Takaichi.
Measured in yen, the TOPIX has trended steadily upward since the Nakasone era, but once returns are converted into U.S. dollars, the picture changes dramatically. As the chart below illustrates, a global investor who bought Japanese equities at the peak of the 1989 bubble would not have made a single dollar of profit until September 2025. The pattern is striking. Japanese equities often rally at the start of a new prime minister’s term as markets price in reform and growth, only to fade later when results fall short of expectations. Today we are still in the honeymoon phase of the Kishida–Takaichi policy era, but if history
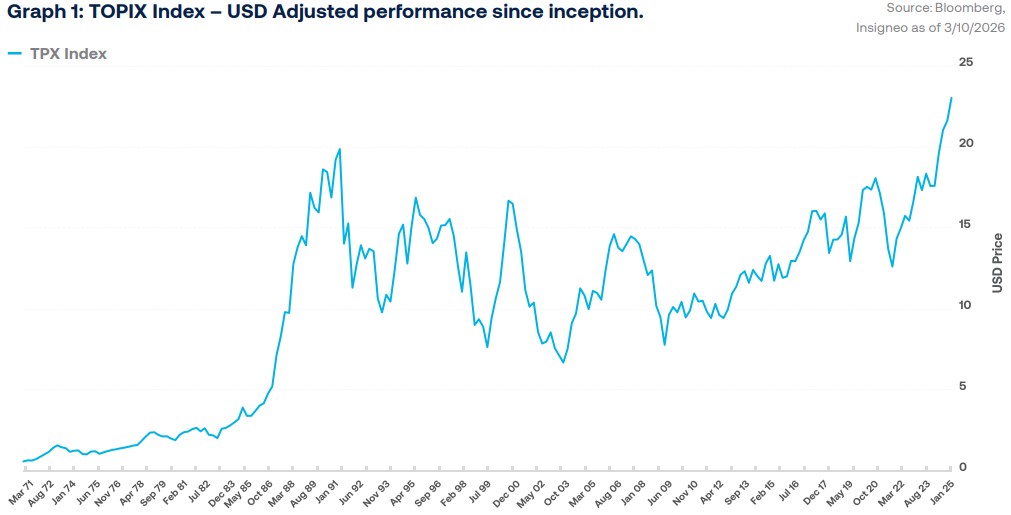
is any guide, that early optimism eventually gives way to reality, and the market tends to correct.
So why is Japan’s political story now tied to Korea’s surging tiger market? The answer lies in the waters of the Strait of Hormuz.
Like Japan, Korea’s main equity benchmark, the KOSPI, has been flying over the past year, delivering an aston- ishing 75.6% return in 2025. While the index is heavily exposed to semiconductors, electronics, and indus- trial exporters, part of this outperformance can be attributed to an unexpected factor: leverage.
So, what exactly is happening in Korean markets? Over the past few years, South Korea has quietly become one of the most active retail trading
environments in the world. The country now has more than 100 million trading accounts, backed by a record USD 22 billion in margin financing. As key sectors within the index, particularly semiconduc- tors, began to outperform, retail investors increas- ingly amplified the rally by deploying large amounts of leverage, pouring fuel on the fire, carrying the momentum into 2026.
Given the highly cyclical, export-driven nature of South Korea’s economy, rising geopolitical tensions in the Middle East, particularly the conflict involving Iran, have started to cast a shadow over the stability of KOSPI-listed companies. While some bullish investors had been targeting the index to reach 6,500, the market has started to correct in recent days.
In fact, trading had to be partially halted three times this month to prevent cascading margin calls and
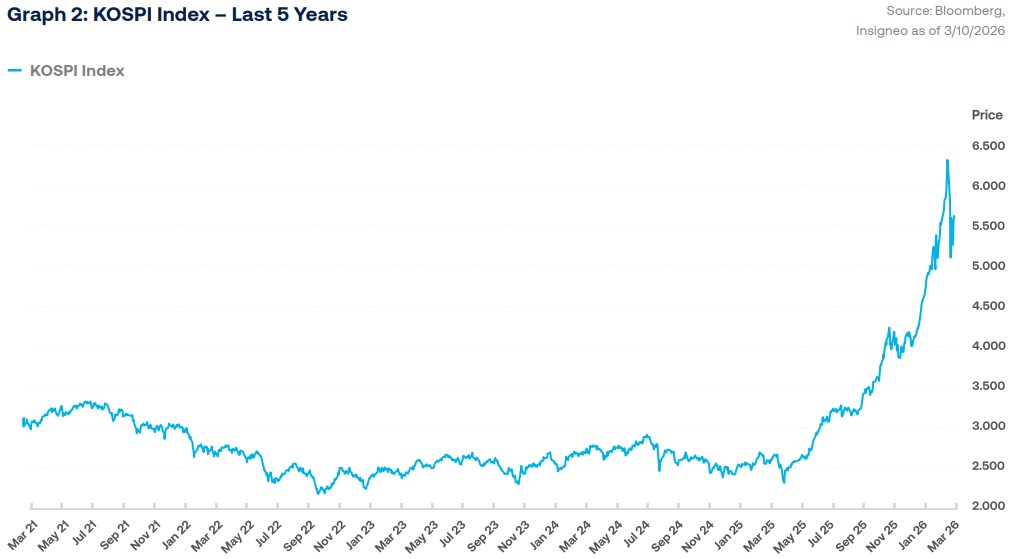
forced liquidations. Korean markets are now caught in a tug-of-war: foreign investors are reducing expo- sure in search of safer assets, while highly leveraged retail traders attempt to time the bottom. Even after the index dropped by as much as 12% in a single trading session, local investors continued to buy the dip, betting that the selloff will prove temporary.
Yet, beneath the volatility lies a deeper issue. South Korea is especially exposed to energy-market disrup- tion because it relies heavily on Middle Eastern oil and LNG, making higher oil prices and stress around the Strait of Hormuz a direct concern for corporate margins and market sentiment.
By now, we have all heard that approximately 20% of the global oil supply goes through the Strait of Hormuz, so any de facto shut down of this waterway is consequential in its own right. However, the global implications do not end there. Although the Strait is not the only route to export oil and gas out of the Middle east, it is by far the most important. If oil cannot flow through the straight, countries in the region must curtail production due to limited storage capacity. In other words, if the storage tanks get full, why keep producing when products cannot be exported? However, the issue is even more conse- quential for South Korea and Japan, both of which remain heavily dependent on Middle Eastern crude. Roughly 70% of South Korea’s oil imports come from the region, while Japan’s reliance is even greater, with close to 90% sourced from the Middle East. That leaves both economies acutely exposed to any disruption in the Strait of Hormuz. Given that both of these countries are predominantly manufac- turing-based economies, higher oil prices mean higher input costs for the creation of new products.
But the potential problems do not end there.
We all know that the U.S. Dollar has traditionally been a relative safe haven in times of crisis. However, this currency is also intrinsically tied to the oil markets, as global oil prices tend to be quoted in USD, and the commodity is traded in this currency. As a result, a prolonged conflict could push the U.S. Dollar higher, particularly against other currencies that rely on oil imports, such as the Japanese Yen and South Korean Won. In essence, both countries are being hit through multiple channels by the conflict in Iran. Higher oil prices raise input costs, squeeze corporate margins, and increase macro- economic instability. At the same time, rising oil prices tend to support a stronger USD, which in turn puts pressure on local currencies. A weaker currency can, at the margin, help exports, but because oil is priced in USD, it also makes already elevated energy costs even more in local terms.
Let us further explore the potential effects for each country. Starting with Japan, it is important to remember that this country has two main equity indices, the Nikkei 225, and the TOPIX. Although both indices track Japanese companies, their composition varies. Composed of roughly 230 companies, the price-weighted Nikkei tends to have a higher concen- tration in a smaller number of companies, much like the Dow Jones Industrial Average index in the United States. However, unlike its counterpart in the U.S., most companies in this index tend to fall in the tech- nology or technology-related sectors. In contrast, the market cap-weighted TOPIX is comprised of more than 1600 companies, with the largest companies representing a larger weight in the index. As a result, Japan’s largest companies tend to have a higher weighting in the index. Given that the country’s largest companies tend to be in the industrial manu- facturing sector, Topix has a high degree of exposure to established automotive companies such as Toyota and Mitsubishi, as well as electronics companies like Sony and Hitachi. Although differences in index composition cause them to respond somewhat differently across market environments, the conflict with Iran will weigh on both, especially if it lasts longer than expected. A recent study published by Morgan Stanley showed that the duration of exogenous shocks tends to impact different sectors in the country in different ways. Initially, commodity- oriented sectors tend to outperform at the onset of a conflict; however, this outperformance tends to retreat as the length of the conflict grows. This dynamic makes sense, as the initial shock from the onset of the conflict with Iran exerted a large degree of downside pressure for Japanese indices, who are light on commodity-oriented sectors, but heavy in manufacturing and exports.
A similar dynamic applies to South Korean equity markets, although with different undertones. Much like Japan, South Korea’s equity index, the KOSPI, is comprised of technology-oriented and manufac- turing companies. In fact, approximately two-thirds of the index is comprised of these two sectors. But there is a twist. Although KOSPI is made up of more than 700 companies, two behemoths in the tech- nology sector, Samsung Electronics and SK Hynix, comprise more than one third of the index. This over- concentration makes it susceptible to large moves in either company. To this point, the KOSPI was the best performing global equity index in 2025, led by the AI boom. However, this year it has seen one of the most significant pullbacks given the conflict in Iran. As previously mentioned, another interesting dynamic in this market is the tug of war between foreign and domestic investors in Korea. However, this dynamic can act as a double-edged sword, providing some support when local investors step into the index as foreigner investors exit, but also potentially exacer- bating downward moves if both groups of investors move in the same direction. So far, the push and pull between both groups has provided some level of support. However, if the conflict lasts longer than expected, domestic investors who stepped in to buy the dip could eventually exit the market as well, pushing the KOSPI lower as they head for the exits.
History suggests that both Japanese and Korean equities may still have room to run, particularly after the recent pullback. But the next chapter for both markets will be written by the duration and intensity of the conflict with Iran. If tensions fade, the rallies could resume; if the conflict drags on, today’s upside could quickly give way to more meaningful down- side risks such as higher oil prices, currency pres- sure, and weaker sentiment begin to bite.
Insigneo Financial Group, LLC comprises a number of operating businesses engaged in the offering of brokerage and advisory products and services in various jurisdictions. Brokerage products and services are offered through Insigneo Securities, LLC, a broker-dealer registered with the U.S. Securities and Exchange Commission (“SEC”) and member of FINRA and SIPC. Investment advisory products and services are offered through Insigneo Advisory Services, LLC, an investment adviser registered with the SEC. Insigneo has affiliated companies in different locations, so it is important to understand which entity you are conducting business with. Please visit https://insigneo.com/legalentities/ for more information about the differences between these companies, their locations, and what that means for you.
This material should not be construed as an offer to sell or the solicitation of an offer to buy any security. It is for general information purposes only. To the extent that this material discusses general market activity, industry or sector trends or other broad-based economic or political conditions, it should not be construed as research or investment advice. To the extent that it includes references to securities, those references do not constitute a recommendation to buy, sell or hold such security. It does not constitute a recommendation or a statement of opinion, or a report of either of those things and does not, and is not intended, to consider the particular investment objectives, financial conditions, or needs of individual investors. Any target prices provide reflect our current expectations, are subject to change and may not be achieved due to a variety of risks, including changes in economic conditions, interest rates, geopolitical developments, and issuer-specific factors. The target price does not guarantee future results and should not be relied upon as a sole basis for investment decisions.
Investments involve significant risks, and it is possible to lose some or all of your principal investments and therefore may not be suitable for everyone. Always consider whether any investment is suitable for your particular circumstances and, if necessary, seek professional advice from your Investment Professional. This material may contain opinions, expressions, and estimates that represent the analysis and perspective of Insigneo Securities, LLC’s Investment Strategy department or its providers at the time of publication. These are subject to change at any time, without notice.
Insigneo Asesorías Financieras SPA se encuentra inscrito en Chile, en el Registro de Prestadores de Servicios Financieros de la Comisión para el Mercado Financiero. Este informe fue efectuado por área de Research & Strategy de Insigneo Securities LLC. o sus proveedores, en base a la información disponible a la fecha de emisión de este. Para evitar cualquier conflicto de interés, Insigneo Securities LLC dispone que ningún integrante del equipo de Research & Strategy tenga su remuneración asociada directa o indirectamente con una recomendación o reporte específico o con el resultado de una cartera.
Aunque los antecedentes sobre los cuales ha sido elaborado este informe fueron obtenidos de fuentes consideradas confiables, no podemos garantizar la completa exactitud e integridad de estos, no asumiendo responsabilidad alguna al respecto Insigneo Securities LLC, Insigneo Asesorías Financieras SPA ni ninguna de sus empresas relacionadas.
Este material está destinado únicamente a facilitar el debate general y no pretende ser fuente de ninguna recomendación específica para una persona concreta. Por favor, consulte con su ejecutivo de cuentas o con su asesor financiero si alguna de las recomendaciones específicas que se hacen en este documento es adecuada para usted. Este documento no constituye una oferta o solicitud de compra o venta de ningún valor en ninguna jurisdicción en la que dicha oferta o solicitud no esté autorizada o a ninguna persona a la que sea ilegal hacer dicha oferta o solicitud. Las inversiones en cuentas de corretaje y de asesoramiento de inversiones están sujetas al riesgo de mercado, incluida la pérdida de capital.
La información base del presente informe puede sufrir cambios, no teniendo Insigneo Securities LLC ni Insigneo Asesorías Financieras SPA la obligación de actualizar el presente informe ni de comunicar a sus destinatarios sobre la ocurrencia de tales cambios. Cualquier opinión, expresión, estimación y/o recomendación contenida en este informe constituyen el juicio o visión de área de Research & Strategy de Insigneo Securities LLC. o sus proveedores, a la fecha de su publicación y pueden ser modificadas sin previo aviso.
Insigneo Asesor Uruguay S.A. está inscripto en el Registro de Mercado de Valores del Banco Central del Uruguay como Asesor de Inversiones. En Uruguay, los valores están siendo ofrecidos en forma privada de acuerdo al artículo 2 de la ley 18.627 y sus modificaciones. Los valores no han sido ni serán registrados ante el Banco Central del Uruguay para oferta pública. Este material está destinado únicamente a facilitar el debate general y no pretende ser fuente de ninguna recomendación específica para una persona concreta. Por favor, consulte con su ejecutivo de cuentas o con su asesor financiero si alguna de las recomendaciones específicas que se hacen en este documento es adecuada para usted según su perfil y estrategia de inversión. Este documento no constituye un asesoramiento ni una recomendación u oferta o solicitud de compra o. Las inversiones en valores negociables están sujetas al riesgo de mercado, incluida la pérdida parcial o total del capital invertido. Cualquier opinión, expresión, estimación y/o recomendación contenida en este informe constituyen el juicio o visión de área de Research & Strategy de Insigneo Securities LLC. o sus proveedores, a la fecha de su publicación y pueden ser modificadas sin previo aviso. Rentabilidades históricas de los productos anunciados no aseguran rentabilidades futuras..
Insigneo Argentina S.A.U. Agente Asesor Global de Inversión se encuentra registrado bajo el N° 1053 de la Comisión Nacional de Valores (CNV) e inscripto ante la Inspección General de Justicia (IGJ) bajo el N° 12.278 del Libro 90, Tomo –, de Sociedades por Acciones. Este informe fue efectuado por área de Research & Strategy de Insigneo Securities LLC. o sus proveedores, en base a la información disponible a la fecha de su emisión. Para evitar cualquier conflicto de interés, Insigneo Securities LLC dispone que ningún integrante del equipo de Research & Strategy tenga su remuneración asociada directa o indirectamente con una recomendación o reporte específico o con el resultado de una cartera. Aunque los antecedentes sobre los cuales ha sido elaborado este informe fueron obtenidos de fuentes consideradas confiables, no podemos garantizar la completa exactitud e integridad de estos, no asumiendo responsabilidad alguna al respecto Insigneo Securities LLC, Insigneo Argentina S.A.U. ni ninguna de sus empresas relacionadas. La información base del presente informe puede sufrir cambios, no teniendo Insigneo Argentina S.A.U. la obligación de actualizar el presente informe ni de comunicar a sus destinatarios sobre la ocurrencia de tales cambios.
Este material está destinado únicamente a facilitar el debate general y no pretende ser fuente de ninguna recomendación específica para una persona concreta. Por favor, consulte con su ejecutivo de cuentas o con su asesor financiero si alguna de las recomendaciones específicas que se hacen en este documento es adecuada para usted. Este documento no constituye una oferta, recomendación o solicitud de compra o venta de ningún valor negociable en ninguna jurisdicción en la que dicha oferta o solicitud no esté autorizada o a ninguna persona a la que sea ilegal hacer dicha oferta o solicitud. Las inversiones en valores negociables están sujetas al riesgo de mercado, incluida la pérdida parcial o total del capital invertido. Cualquier opinión, expresión, estimación y/o recomendación contenida en este informe constituyen el juicio o visión de área de Research & Strategy de Insigneo Securities LLC. o sus proveedores, a la fecha de su publicación y pueden ser modificadas sin previo aviso.